I bet many of you are getting fed up of saying "the Himalayas are a fragile environment", considering it the key issue underlining the AIB - more interesting than a bridge right!!! It is important to understand why it is fragile and how this has affected people; here are just a few examples but there are many more, let me know which ones you think are most important.....
Climate
- Very seasonal, therefore limits agricultural productivity by dictating vegetation. This has limited export potential in a region low on mineral wealth also, and restricted Nepal to low levels in both the Demographic Transition Model and Rostow Model of Development. Could be said that climate consequently restricts carrying capacity of the Himalayas.
- Not correct climate for early industries, like those that developed in the UK, as too hot and lack of water all year round
- Climate controls tourist season, especially that liked to trekking, making reliance on this industry more economically vulnerable
- Climate change in this fragile environment likely to make it more vulnerable
- Climatically controlled hazards such as flooding from glacial outbursts, with risk of flooding and landslides accentuated by deforestation as it reduces interception store and leaves nothing to bind the soil
Landscape
- High altitudes and difficulties of the environment means only really trekking tourism is attracted, with lower Himalayas not accessible due to topography
- Altitude closely linked to climate
- Steep gradient makes settlements harder and mobability challenging, hence poor trade links, therefore more local industry and subsistence agriculture is depended upon ( = anti-globalisation!?!)
- Terracing of landscapes has been implemented to make agriculture easier
Hazards
- Avalanches, especially on roads halt economic activity, severing any trade links due to limited infrastructure
- Mass movement destroys trekking paths, perhaps encouraging tourists to veer of set paths thereby increasing soil erosion in the fragile environment
- Flooding, increased by deforestation
- Such hazards in a LDC wipe out any existing development in the region, whilst making it very unattractive to TNCs and potential appending FDI crucial to initiating cumulative causation
Soils and Ecosystems
- Not a lot of soil! With morraines providing a surface for succession to occur upon but this process is slow
- Gradient is too steep to 'fix' soil, thereby limiting agriculture
- Great leaching of nutrients and erosion/washing away of topsoil
- Great variety of ecosystems, all very climate dependent, not that productive so offer limited benefits for local people
Consequential to the hazards and lack of benefits posed by the fragile environment to people and settlements, rapid urbanisation is occuring, again accentuated by population pressures. However, this is placing enormous pressure on limited resources and infrastructure, thereby hampering development. Practical Action's 'Sustainable Urban Environment' programme aims to help solve this by providing safe drinking water and improving waste management. It is based on building effective partnerships between local governments and NGOs. Education of locals is also key in ensuring sustainability so whilst raw materials required are provided, labour is covered by locals so that they understand how to build and repair the biogas plants and bio-toiliets. This scheme was satarted in 2009, helping 30,000 women and children in 8 settlements around Nepal. Approach taken provides oppurtunities for additional income-generation and socio-economic development to take place, through adoption of a community-managed, de-centralised approach. The use of appropriate technology is sustainable as locals can economically maintain it whilst PracticalAction provide education to do so. Therefore knowledge will be passed to the next generation to sustain the scheme which is helping development start from its grassroots level in small communities and helping solve some of the issues associated with rapid urbanisation that act as barriers to development in Nepal.
I have been asked to write a post regarding interpretation of the photos, so I will try and write that this evening but for now, good luck with the rest of your revision!
Showing posts with label 4B Nepal. Show all posts
Showing posts with label 4B Nepal. Show all posts
Monday, 18 June 2012

Fuelwood - Issues with usage, possiblities to reduce them in Nepal
Fuelwood is used by 80% of the 4.2 million of the households in Nepal. However there are issues with this, similar to those seen in the Sahel. AT remains one of the best options, on a small scale, for Nepal but HEP, if FDI is provided, could go a long way to accelerating development in the region. Many of you many remembering doing this in the Energy module last year, but just incase, here is a basic overview of fuelwood usage in LDCs.........
In LEDC’s fuelwood is a very important source of energy as it is readily available and can provide energy for both cooking and heating. It is estimated that 40% of the global population rely on fuelwood as a source of energy. Honduras source 65% of their primary energy from fuelwood and in many African countries this percentage is substantially higher (often over 90%). The reason that this is such a popular choice is that it is cheap and relatively sustainable. Also the use of fuelwood as a source of energy does not require communities to be connected to a national grid. This means that for remote communities it is often there best source of energy.
Theoretically, fuelwood is a sustainable source of energy as trees can be replanted to replace those used. This will maintain the amount of trees in a region. Although it will take a while for the trees to fully grow, as long as it they are not used faster than they can be replaced, it is renewable. This means that, if afforestation schemes are implemented, that fuelwood can be a sustainable source of energy.
Fuelwood usage in the Sahel
Fuelwood usage in Nepal
If you look back at some of my AS posts from the Energy module, there wil be some stuff on HEP that you may find helpful if you need to refresh you memory....
In LEDC’s fuelwood is a very important source of energy as it is readily available and can provide energy for both cooking and heating. It is estimated that 40% of the global population rely on fuelwood as a source of energy. Honduras source 65% of their primary energy from fuelwood and in many African countries this percentage is substantially higher (often over 90%). The reason that this is such a popular choice is that it is cheap and relatively sustainable. Also the use of fuelwood as a source of energy does not require communities to be connected to a national grid. This means that for remote communities it is often there best source of energy.
Theoretically, fuelwood is a sustainable source of energy as trees can be replanted to replace those used. This will maintain the amount of trees in a region. Although it will take a while for the trees to fully grow, as long as it they are not used faster than they can be replaced, it is renewable. This means that, if afforestation schemes are implemented, that fuelwood can be a sustainable source of energy.
Fuelwood usage in the Sahel
Fuelwood is a major source of energy in the Sahel region.
However, an already dry region has been made drier by the deforestation that
has taken place as the reduction in transpiration has reduced rainfall. The
removal of trees has means that there are no longer any roots to bind the soil
and, as the soil is exposed, it becomes more vulnerable to soil erosion. The
combination of deforestation, over grazing and over cultivation has led to
desertification. Deforestation has also allowed for salinisation to occur. As
the soil is no longer shaded from the sun, the antecedent moisture is
evaporated and, the hot temperatures draw the salts out of the soil. These
salts are toxic to most plants and after this has happened it becomes
increasingly likely that crops will fail.
In the Sahel they have experienced a lack of rainfall since the 1970’s
and famines (the largest one occurring in the 1980’s) because the land is not
very productive and, as the population increases, there are more and more
people to feed.
To
help to remedy the problems created by deforestation many charities have set up
tree planting schemes and have provided ‘magic stones’ which are used to build
walls and trap the nutrients so that crops can be grown. Fuelwood is mainly
used to generate heat which is then used for cooking. Appropriate technology
has been used to make stoves more efficient so that they consume less fuelwood
and so reduce communities’ dependency on fuelwood as a source of energy. Another
method has been to encourage families to use solar cookers instead as this
means that they can cook food without using any energy source apart from the
sun.Fuelwood usage in Nepal
Nepal is situated in the foothills of the Himalayas and so
experiences high levels of precipitation and snow melt. Deforestation is a big
problem in Nepal and only around 29% of the forest cover remains. This is due
to the fact the Nepal sources 87% of its domestic energy from fuelwood. The
forests of Nepal are home to many animals and 2.9% of them are classed as being
endemic, which means that they don’t’ exist in any other country and
deforestation has led to the destruction of their habitats. As well as the
other obvious environmental impacts, deforestation has had some social impacts
as well. For example, the women, who traditionally gather the wood, now have to
spend hours at a time looking for wood and cows have to be taken further afield
to find grazing land. In turn this has escalated the deforestation problem as
grazing animals often eat the tree seedlings before they have a chance to grow
and as demand for fuelwood increases, in relation to population growth, the
problem is spreading. The impacts of deforestation are not only felt in Nepal
though. Deforestation has reduced the interception store and so surface runoff
has been increased. This means that the risk of flooding in Bangladesh has been
increased. Also, as there are not roots to bind the soil or trees to trap
sediment, the risk of landslides has been increased.
To
try and reduce the deforestation problem in Nepal, biogas run cookers are being
installed in rural areas. Most people leaving in rural areas own at least one
cow and the idea is that a system is
installed that collects the methane produced when livestock manure decomposes
and then the gas collected is used to light stoves. This not only reduces
dependency on fuelwood as a source of energy but also has health benefits as
the smoke produced when either fuelwood or dried dung is burnt causes many
respiratory problems. Even the waste left behind can be utilised as it works as
a good, natural, fertiliser. Another
project has also been put in place which aims regenerate the forests by
promoting the planting of trees that are grown in tree nurseries by local
volunteers. If you look back at some of my AS posts from the Energy module, there wil be some stuff on HEP that you may find helpful if you need to refresh you memory....
Saturday, 16 June 2012
Presenting the data in 4B Nepal AIB
Hello everyone, I have had a request to go over the data representation specific to this AIB and fortunately there is not a lot of data so this post will be relatively short - I hope the revision is going well!!!
Figure P2 - Climate of Kathmandu
Well there is only really one option for this one..... a climate graph!!! So the bars represent precipitation (in mm) and the line temperature ( in degrees C), therefore there are often 3 axis which all need to be numbers, with months on the x-axis. Not really sure what else to say about the climate graph other than it is good as you can represent both precipitation and temperature on the same graph which in the case of Kathmandu shows clear correlation between the two i.e the warmest month (July) is also the wettest, it is very easy to highlight peaks and easy to plot/read. Interestingly, if you compare this data set with the P3 (the number of tourists) the lowest number of tourist arrivals seems to coincide with the most 'extreme' weather, which could possibly be explained by looking at P4 at due to why people visit Nepal.
Figure P3 - Total tourist arrivals in Nepal, excluding Indians, per month (2007)

For this data set, a line graph is probably most suitable as it suugests conitinuous variation over time, something that is crucial when displaying tourist arrivals per month, but most importantly only continuous variation in one variable. Line graphs are visulally effective and easy to read sa peaks in the data are clearly visual. This therefore is more appropriate than stacked bar charts, which represnt a range if information which is not related, or a bar chart which suggests discontinuous variation. So to plot the line graph months of the year should be placed along the x-axis and number of tourist arrivals each month along the y-axis. On the y-ais I would use a false origin and start the scale at 15,000 and then go up in 5,000. After labelling bith axis, the data points in P3 should be plotted accordingly.
Figure P4 - Tourist arrivals in Nepal, by type (2007)

 Now, I think there are two options for this one! First up is a pie chart which can be used to show the share total value of something. They are visually effective but difficult to read and accurately assess the percentages, whilst also not offering raw values - although to compare something precentages are best to use. To construct a pie chart you need to first draw a circle! Then the data needs to be converted into percentages (divide the number by the total and times by 100), then multiply by 3.6 to convert it to degrees. You are meant to start at a vertical position and measure round clockwise from this point, and include a key. Another option is a stacked bar chart which shows a range of information on the same topic which is not necessarily related. This is an easier way to clearly compare date from different locations, and is less time consuming as can either be plotted with percentages or raw values. There is probably not a lot of difference between the two, but which ever one you pick you need to be able to justify why you picked that one. One issue though with the data in P$ is that there is significant overlap between the categories, with the possibility of a tourist being considered in more than one, therreofre it is debatable how reliable/significant trends shown are.
I realise that this sounds really patronising but I think the main lesson I have learnt from the Poole exam is that you have to explain things really well and write as if the examiner doesn't really know an awful lot when it comes to questions like 'how would you represent data in fig....?'. Therefore not only to do you need to know how to plot each one, but also justification for use. The above are the ones that Nick feels are the most likely to come up as are relevant to the data in the AIB, but briefly looking over other methods of representation may be a good idea. The main other skill that Nick has mentioned a lot is commenting on photos, perhaps talking about to what extent they show the Himalayas to be a fragile environment....remembering that labelling pictures is considered a geographical skill! A quick note on this, I would say that the pictures in the AIB and those referred to (probably a very good idea to look at those before Tuesday!!!) are arguably biased as not only were they taken by a tourist so show touristy places, and therefore regions damaged by tourism but they were also taken by a geographer who would no what to look for in regards to environmental fragility and damage. But they do still offer a good insight in Nepal, and considering we couldn't exactly go there on a fieldtrip, it is all we really have to rely on!
Anyway, I hope this was helpful, let me know what you think about this, and if you have any more requests....
Figure P2 - Climate of Kathmandu
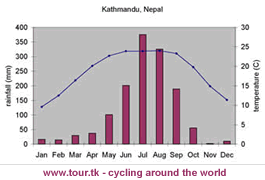 |
| Don't think this is the exact same data as in AIB! |
Figure P3 - Total tourist arrivals in Nepal, excluding Indians, per month (2007)

For this data set, a line graph is probably most suitable as it suugests conitinuous variation over time, something that is crucial when displaying tourist arrivals per month, but most importantly only continuous variation in one variable. Line graphs are visulally effective and easy to read sa peaks in the data are clearly visual. This therefore is more appropriate than stacked bar charts, which represnt a range if information which is not related, or a bar chart which suggests discontinuous variation. So to plot the line graph months of the year should be placed along the x-axis and number of tourist arrivals each month along the y-axis. On the y-ais I would use a false origin and start the scale at 15,000 and then go up in 5,000. After labelling bith axis, the data points in P3 should be plotted accordingly.
Figure P4 - Tourist arrivals in Nepal, by type (2007)

 Now, I think there are two options for this one! First up is a pie chart which can be used to show the share total value of something. They are visually effective but difficult to read and accurately assess the percentages, whilst also not offering raw values - although to compare something precentages are best to use. To construct a pie chart you need to first draw a circle! Then the data needs to be converted into percentages (divide the number by the total and times by 100), then multiply by 3.6 to convert it to degrees. You are meant to start at a vertical position and measure round clockwise from this point, and include a key. Another option is a stacked bar chart which shows a range of information on the same topic which is not necessarily related. This is an easier way to clearly compare date from different locations, and is less time consuming as can either be plotted with percentages or raw values. There is probably not a lot of difference between the two, but which ever one you pick you need to be able to justify why you picked that one. One issue though with the data in P$ is that there is significant overlap between the categories, with the possibility of a tourist being considered in more than one, therreofre it is debatable how reliable/significant trends shown are.
 I realise that this sounds really patronising but I think the main lesson I have learnt from the Poole exam is that you have to explain things really well and write as if the examiner doesn't really know an awful lot when it comes to questions like 'how would you represent data in fig....?'. Therefore not only to do you need to know how to plot each one, but also justification for use. The above are the ones that Nick feels are the most likely to come up as are relevant to the data in the AIB, but briefly looking over other methods of representation may be a good idea. The main other skill that Nick has mentioned a lot is commenting on photos, perhaps talking about to what extent they show the Himalayas to be a fragile environment....remembering that labelling pictures is considered a geographical skill! A quick note on this, I would say that the pictures in the AIB and those referred to (probably a very good idea to look at those before Tuesday!!!) are arguably biased as not only were they taken by a tourist so show touristy places, and therefore regions damaged by tourism but they were also taken by a geographer who would no what to look for in regards to environmental fragility and damage. But they do still offer a good insight in Nepal, and considering we couldn't exactly go there on a fieldtrip, it is all we really have to rely on!
Anyway, I hope this was helpful, let me know what you think about this, and if you have any more requests....
Management of tourism in Lakshadweep - lessons to be learnt for Nepal???
Attempts to regulate tourism in Nepal are quite limited (mainly to Sherpas and paying tourists back deposits for returning with rubbish) and subsequently the environment has started to suffer. However there are other regions of the world that have started to successfully manage their tourim.....
 Lakshadweep is a tropical
island system, with environmental sustainability at the heart of its development. The heritage of ecology
and culture is supported by an extremely fragile ecosystem, as with in the Himalayas. However Lakshadweep are committed to the
cause of eco-tourism, following a
middle path between tourism promotion and environmental conservation. The impacts of tourism on the environment is carefully monitored, ensuring that promotion of tourism is consistent with
ecological concerns. It seems that an effective strategy has been implemented to avoid excess pressure on the
environment, meaning that tourism does not exceed the carrying capacity of the islands.
Lakshadweep is a tropical
island system, with environmental sustainability at the heart of its development. The heritage of ecology
and culture is supported by an extremely fragile ecosystem, as with in the Himalayas. However Lakshadweep are committed to the
cause of eco-tourism, following a
middle path between tourism promotion and environmental conservation. The impacts of tourism on the environment is carefully monitored, ensuring that promotion of tourism is consistent with
ecological concerns. It seems that an effective strategy has been implemented to avoid excess pressure on the
environment, meaning that tourism does not exceed the carrying capacity of the islands.
 In order not to adversely affect the physical environment
promotion of tourism only occurs in those islands that
can sustain it keeping in view the concept of carrying capacity. The facilities
are developed in such a way that they do not result in loss of bio-diversity. No
development is permitted in geologically unstable zone. Adequate buffer zones exist between development and the cf existing shoreline, including a ban on high buildings whilst all construction materials/methods are
compatible with environment and height, shape and location of building merge
with the natural vegetation.
In order not to adversely affect the physical environment
promotion of tourism only occurs in those islands that
can sustain it keeping in view the concept of carrying capacity. The facilities
are developed in such a way that they do not result in loss of bio-diversity. No
development is permitted in geologically unstable zone. Adequate buffer zones exist between development and the cf existing shoreline, including a ban on high buildings whilst all construction materials/methods are
compatible with environment and height, shape and location of building merge
with the natural vegetation.
All tourism development schemes are first analyzed from environmental impact point of view and only if they meet the norms in this regard implementation is taken up. EIA includes...


Harsh environments are in some cases often the most fragile and Hawaii due to its tectonic setting can be described as quite a fragile environment. Living with geomorphological hazards is not easily and can be detrimental to the economy, therefore development but Hawaii, as with Iceland, have started to utilise tourism as a way to enable development in harsh environments. By 1966 in Hawaii, the tourism industry had overtaken the export of sugar and pinapples as the main source of income and since then, with the invention of the Boeing 747, this industry has boomed. An estimated 7,000,000 tourists visited Hawaii in 2009, with the average American tourist spending $180 a day and Asian tourists $250 a day. Tourism brings huge benefits to Hawaii such as:
- Provides 35% of the country's total revenue ($9billlion in 2009)
- Generates over 18,000 jobs, mainly in hotels, which represents over half the total employment of the state
- Income from tourism provides money to protect the environment as well as helping to pay for health care, education and social security on Hawaii
Similarities can therefore be drawn with Nepal as the tourism industry accounts for aruond 10% of their GDP, but most importantly provides a direct income for local people in an area where agricultural productivity is limited. However, there are also similarities between the issue associated with tourism's exploitation of the environment......

 .....There are some issues with tourism linked to vulcanicity. Honeypot sites have developed around the volcanoes, which are not evenly distributed so overcrowded results, and the appending impacts of soil erosion and various forms of pollution are causing issues for the surrounding environment. Then greater pressure is exerted to increase size of visitor centres which only accentuates detrimental impacts. Management and strict guidelines, such as those imposed in the USA National Parks, can reduce the impacts but, especially in developing countries these are no legally enforced. How many people actually live by the rules, 'leave nothing, take only photographs'? Unfortunately for the delicate ecosystems many of us visit, not enough, so does this mean that it is not possible for true eco-tourism to exist in reality? Perhaps that is a topic for another blog post but whilst tourism can have social and economic benefits for an area, often without carfeul management and inforcement of legislation it can harm to environment and currently this is being seen in Nepal.
So, can Nepal learn any lessons from what has been done in Lakshadweep and Haiti? Well I definently think that carrying out an EIA would be a very good idea! To me I think the main issue at present is the number of tourists, which seems to exceed the carrying capacity of the Himalayas, therefore perhaps raising the cost of visas would reduce the number visiting Nepal each year. The difficultly is that due to lack of resources and minerals, tourism is crucial to this developing country and is likely to continue to be so unless TNCs relocate and provide FDI to kickstart other industry...... what is clear though is that something needs to be done to reduce the detrimental impact of tourism in this fragile environment.
What steps do you think need to be introduced? Let me know what you think!
 Lakshadweep is a tropical
island system, with environmental sustainability at the heart of its development. The heritage of ecology
and culture is supported by an extremely fragile ecosystem, as with in the Himalayas. However Lakshadweep are committed to the
cause of eco-tourism, following a
middle path between tourism promotion and environmental conservation. The impacts of tourism on the environment is carefully monitored, ensuring that promotion of tourism is consistent with
ecological concerns. It seems that an effective strategy has been implemented to avoid excess pressure on the
environment, meaning that tourism does not exceed the carrying capacity of the islands.
Lakshadweep is a tropical
island system, with environmental sustainability at the heart of its development. The heritage of ecology
and culture is supported by an extremely fragile ecosystem, as with in the Himalayas. However Lakshadweep are committed to the
cause of eco-tourism, following a
middle path between tourism promotion and environmental conservation. The impacts of tourism on the environment is carefully monitored, ensuring that promotion of tourism is consistent with
ecological concerns. It seems that an effective strategy has been implemented to avoid excess pressure on the
environment, meaning that tourism does not exceed the carrying capacity of the islands. 
All tourism development schemes are first analyzed from environmental impact point of view and only if they meet the norms in this regard implementation is taken up. EIA includes...
| 1 | All proposed construction should have thatched roof or tiled sloping roof. |
| 2 | Only bio toilets to be installed as far as possible. |
| 3 | Rain water harvesting to be set up to conserve fresh water. |
| 4 | Use of Pump Sets should be minimized; the pump set in any case should have a cut off mechanism to ensure that water below the minimum safe level is not drawn. |
| 5 | Waste disposal system like incinerators for non-recyclable/non bio degradable waste should be installed and system of returning all non-biodegradable waste must be in position. |
| 6 | Minimum cutting of tress/ greenery and maximum plantation of trees, plants, shrubs and creepers. |
| 7 | Carrying capacity study of the island before taking up development in any uninhabited island |
| 8 | A regular system to educate tourists about environment fragility of eco system |


Harsh environments are in some cases often the most fragile and Hawaii due to its tectonic setting can be described as quite a fragile environment. Living with geomorphological hazards is not easily and can be detrimental to the economy, therefore development but Hawaii, as with Iceland, have started to utilise tourism as a way to enable development in harsh environments. By 1966 in Hawaii, the tourism industry had overtaken the export of sugar and pinapples as the main source of income and since then, with the invention of the Boeing 747, this industry has boomed. An estimated 7,000,000 tourists visited Hawaii in 2009, with the average American tourist spending $180 a day and Asian tourists $250 a day. Tourism brings huge benefits to Hawaii such as:
- Provides 35% of the country's total revenue ($9billlion in 2009)
- Generates over 18,000 jobs, mainly in hotels, which represents over half the total employment of the state
- Income from tourism provides money to protect the environment as well as helping to pay for health care, education and social security on Hawaii
Similarities can therefore be drawn with Nepal as the tourism industry accounts for aruond 10% of their GDP, but most importantly provides a direct income for local people in an area where agricultural productivity is limited. However, there are also similarities between the issue associated with tourism's exploitation of the environment......

 .....There are some issues with tourism linked to vulcanicity. Honeypot sites have developed around the volcanoes, which are not evenly distributed so overcrowded results, and the appending impacts of soil erosion and various forms of pollution are causing issues for the surrounding environment. Then greater pressure is exerted to increase size of visitor centres which only accentuates detrimental impacts. Management and strict guidelines, such as those imposed in the USA National Parks, can reduce the impacts but, especially in developing countries these are no legally enforced. How many people actually live by the rules, 'leave nothing, take only photographs'? Unfortunately for the delicate ecosystems many of us visit, not enough, so does this mean that it is not possible for true eco-tourism to exist in reality? Perhaps that is a topic for another blog post but whilst tourism can have social and economic benefits for an area, often without carfeul management and inforcement of legislation it can harm to environment and currently this is being seen in Nepal.
So, can Nepal learn any lessons from what has been done in Lakshadweep and Haiti? Well I definently think that carrying out an EIA would be a very good idea! To me I think the main issue at present is the number of tourists, which seems to exceed the carrying capacity of the Himalayas, therefore perhaps raising the cost of visas would reduce the number visiting Nepal each year. The difficultly is that due to lack of resources and minerals, tourism is crucial to this developing country and is likely to continue to be so unless TNCs relocate and provide FDI to kickstart other industry...... what is clear though is that something needs to be done to reduce the detrimental impact of tourism in this fragile environment.
What steps do you think need to be introduced? Let me know what you think!
Thursday, 14 June 2012
4B Nepal - An Introduction
Well I think it is safe to say that that exam wasn't much fun at all (bit of a disaster in my case to be honest!) but for many of you that will mark the completion of A-level Geography so congratulations!!! However, some, like me, can't get too excited yet as we still have 4B to do. Therefore over the weekend, I am going to try and write some 4B stuff up on here, so stay tuned, remember though that all the skills have already been covered back in January so I am not intending to go over this again, just click on the Geographical Skills tab to go straight there....
What better place to start than with the issue....
People are concerned about damage to the fragile environment and ecosystems because of tourism which has arisen because of the need to develop but might be resolved by appropriate technology and sustainable energy sources.
The AIB/issue present is based in the Himalayas, mainly in Nepal. The Himalayas are a mountain range in Asia that stretches from north India, through Pakistan, India, Nepal, Butan, Bangladesh, Myanmar and China. Mount Everest and K2 are located here as well as the Tibetan Plateau to the northwest. They are situated north of the equator and influence monsoon patterns. They are a fragile environment with 15,000 glaciers, even though they are close to the tropics, indicating the influence of altitude on climate. There are 6 parallel climate zones within the Himalayas mountain range which can be identified by their altitude, and therefore the vegetation that grows. However, fragility of the ecosystems increases with altitude.
Summary of 4B Nepal AIB Well that is a brief summary, hopefully I will find the time at the weekend to write up some more details before the exam on Tuesday but let me know if there is anything you would like me to focus on.....
What better place to start than with the issue....
People are concerned about damage to the fragile environment and ecosystems because of tourism which has arisen because of the need to develop but might be resolved by appropriate technology and sustainable energy sources.
The AIB/issue present is based in the Himalayas, mainly in Nepal. The Himalayas are a mountain range in Asia that stretches from north India, through Pakistan, India, Nepal, Butan, Bangladesh, Myanmar and China. Mount Everest and K2 are located here as well as the Tibetan Plateau to the northwest. They are situated north of the equator and influence monsoon patterns. They are a fragile environment with 15,000 glaciers, even though they are close to the tropics, indicating the influence of altitude on climate. There are 6 parallel climate zones within the Himalayas mountain range which can be identified by their altitude, and therefore the vegetation that grows. However, fragility of the ecosystems increases with altitude.
Summary of 4B Nepal AIB Well that is a brief summary, hopefully I will find the time at the weekend to write up some more details before the exam on Tuesday but let me know if there is anything you would like me to focus on.....
Subscribe to:
Posts (Atom)