Showing posts with label Vorticity. Show all posts

Thursday, 1 September 2011

Met Office Work Experience - Day 4 (for 24-08-2011)

Last week I was fortunate enough to go back to the Met Office for a few more days and, yet again, I learnt so much, so I thought I would try and briefly go over some of the stuff I learnt. So, what did I get up to on Wednesday (I should probably say us as Millie also came along for the day!).......


Well, first up was a discussion about a possible thermohaline circulation shutdown. I have to admit that I find the idea of a future THC shutdown really interesting and it is an area that I have given a lot of thought to over the past few weeks, hence my rather long list of questions (I am guessing Millie quite enjoyed the fact that, for once, she wasn't the one my list of questions were aimed at!). As with the previous discussion groups we covered an awful lot so I am going to try and summarise the key points - feel free to ask if you want to know more! Again, much of the discussion revolved around the idea of hysteresis (which refers to the dependence of the state of a system on the history of its state, with the lag in a variable property of a system with respect to the effect producing it as this effect varies - thats kind of the idea of it all, I think). Honestly all of this takes a lot of time to get used to..... trust me I have been trying since we first started our EPQ's and I am, perhaps, only just starting to make some real progress!
Sorry I know its not the best drawing of the graph
but I was trying to make it as simple as possible! Basically, MOC
strength (in Sv) is up the y-axis and volume of freshwater
along the x-axis
I realise that I have spoken a bit about this graph before but, what excatly are the key points to take from it? Firstly, that a freshwater input does have the ability to weaken the THC and that a reduction in the freshwater present is crucial to a re-initiation of the THC. Secondly, that the THC seems to have two stable states; a stable 'off' and a stable 'on' state; and that, because of this, the same volume of freshwater input can be responsible for the THC to be in two different states. Next up, is the fact that it seems to suggest that when the THC starts to re-initate, although for a while it will operate at a slightly lower intensity than before, it will return to its original state once the forcing has reached a constant or is reduced. Finally, is the idea that the graph indicates that a irreversible change to the THC is impossible/highly unlikely, as, as soon as the forcing reaches consistency or is reduced, the THC does in fact start to recover and return to its original state. So, does this mean that global climate change cannot provoke an irreverisble change to the THC? Well, this graph and many of the models do seem to suggest this (although predictions past 2100 haven't been made) but it is hard to say with much confidence as there is so much uncertainity over the stability of the ice sheets around the world and how much freshwater they are likely to input to the oceans if they were to melt. Due to this, most predictions are based on our more certain estimates of alterations to precipitation, directly resulting from global warming, and simply our 'best guess'.


Perhaps the greatest challenge facing researchers at the moment is applying this graph to real life - something which is only made more difficult by the complications generated by feedbacks and difficulties in validating model projections due to a lack of observations of the MOC strength.  The feedbacks are also an area that intrigues me (there are loads involved in the earth system and I think we briefly touch on a few at A2) although, again, they can get a bit complicated..... There are primarily two feedbacks that I am most concerned about, in the oceans, with reference to my EPQ theme and that is the advective feedback and the convective feedback and it is the existence of these two positive feedbacks that generates the non-linear behaviour of the ocean circulation and determines the stability of the THC. What excatly do these feedbacks involve?


  • Advective feedback:- the THC advects salty water northward in the Atlantic, which enhances salinity and density in the north which, in turn, keeps the THC circulating.
  • Convective feedback:- convective vertical mixing continually removes freshwater from the surface in regions of net precipitation; thus prevents the formation of a fresh buoyant surface layer which is capable of inhibiting convection.
These feedbacks tend to reinforce the contemporary circulation pattern and maintain its stability once it has started. It is, therefore, because of them that the circulation can be stable in more than one state (i.e. is said to have multiple equilibrium states of the circulation which can exist) - this includes what would be classed as the extremes, a stable 'off' and stable 'on' state. The ability of the THC to exist in a stable state whilst the NADW formation is switched, both, either 'on' or 'off' is attributed to the advective feedback, whilst the convective feedback is thought to lead to stable states with differing convection patterns in the North Atlantic (so, for example, stable states with or without convection in the Labrador Sea). Understanding these feedbacks and then being able to replicate them in models is critical if more certain predictions for the future of the MOC can be made. I could probably talk about this for a long time but I think I will leave it at this for the moment (just let me know if you want to know more!) so I can move on to what else we did......

Snowfall last winter, as it has done over previous years, caused
major disruption to the lives of people up and down the
country. If this is going to keep occuring, should we be
more prepared? Well, some town councils have started to think
this way - my local town council announced the other day
that they had invested in 6 new shovels to use
to clear the streets if we have more snow this year -
something tells me that more would need to be done if we were
to experience 4-5 months of snow each year!
After this discussion, we talked about the impacts that a future MOC shutdown would have on the world, although primarily the UK and I should probably warn you that they do not look to great! In terms of temperature, after a complete cessation, models have projected anything up to a 8 degree drop for the UK accompanied by 4-5 months of snow cover, higher wind speeds, less rainfall, quite a high local sea-level rise and an increased frequency and severity in extreme weather events. After the problems caused by snowfall on recent years I think I will focus on how society would have to adapt if we were to annually experience 4-5 months of snow cover. The short period of snowfall experienced over past years caused societal collapse in this country as we simply did not have the means or the knowledge to adapt and so the thought of longer periods of snow throughout winter every year, as a result of a NADW cessation, should be of concern to politicians whom received much criticism for an apparent inability to deal with the situation. Agricultural patterns are likely to be the first to be affected; with growing seasons altered, a seasonal shift back to more labour intensive time consuming work, both quantity and quality of winter vegetables reduced with farmers unable to lift them during frosts and greater expense involved in keeping livestock. As with transport on a whole, food distribution would be restricted with particular issues in relation to fresh food. In January 2010, one milk producing company, who supply 80% of the organic milk consumed in Britain, had to throw away 100,000 litres of milk as tankers could not collect it and farms do not have the storage capacity. Combining the above would incur raised food prices and, in the long run, possibly even provoke farmers to move away from commercial-sized farms to reduce expenses. People’s mobility would be inhibited with roads unsafe to navigate and public transport not running, leaving those in remote rural locations and the elderly isolated with limited access to amenities, an issue that would only increase year on year if the UK’s population continued to age. Alternatively, this could promote a switch to people living more self-sufficient lifestyles with vegetable patches in gardens etc. so that they would not be as reliant on supermarkets as a food source. Further strain on already stretched health care would be generated, with accidents more likely in icy conditions, increase in time taken to reach those injured and issues with both patients and staff reaching hospitals. Education would be affected (yes, I realise that we all love it when college is closed due to snow but it would soon become a great convinence if it was to happen over a long period every year!), with snow capable of causing significant disruption during exam periods and to those who presently travel further afield to gain an education in the best possible institutions. One of the largest impacts would be on the economy, with the 2010 snowfall reducing economic growth by 0.5% in the UK, as consumer spending is often at its greatest approaching Christmas and so better contingency plans would have to be generated to minimise the impact on the economy. Increased snow cover could provoke a shift in employment sectors as construction work could become seasonal, therefore affect unemployment levels and perhaps increase the percentage of the population with office based work that, during winter months, could be completed at home. This could, in turn, reduce the number of TNC’s attracted to the country whose arrival often prompts cumulative causation. Finally, if this prolonged snow cover is going to occur frequently, then more will be expected of local councils to deal with the situation, keep roads gritted and services and schools open. That is just a few of the impacts that increased snowfall would have on the UK, and there are many other impacts associated with the other factors. So, how do you think society would cope with the impacts of a future MOC shutdown?


To finish off what was, again, a really great day, we attended a seminar on 'The Effect of the QBO on Lateral Mixing and Transport in the Stratosphere' and, to be honest, I only managed to follow like the first 5 minutes (which was still a struggle depsite the fact I tried to do a bit of reading up on QBO the day before). The other seminars I attended previously were hard enough to follow but this one very very quickly went way way way over my head! I will try and cover the real basics of QBO but I am still very unsure of it all so you will have to bare with me.....

QBO observations - note alternating westerly and
easterly phases
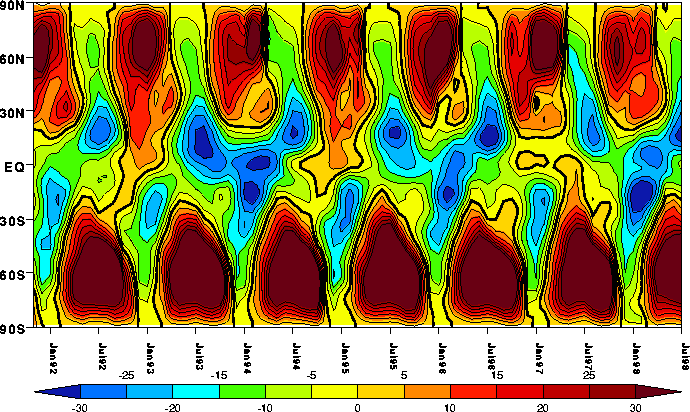
QBO (known as the quasi-biennial oscillation) = the layer of winds that encircle the Earth in the lower stratosphere, at altitudes 20-40km, between latitudes 15N and 15S. They blow at velocities of 25 to 50m/s. They are alternately easterly and westerly, reversing every 13 months (if anyone knows how or why they do this I would be very interested to know!). QBO was originally known as the Krakatoa winds, with this name being dervived from the role that the winds played in dispersing the ash, from the 1883 eruption of Krakatoa, in the atmosphere. The QBO is a slow oscillation, in terms of both strength and direction, of the zonal wind in the lower and middle stratosphere over the Equator of the Earth's atmosphere. Overall, it has a period of about 2 years and has been observed, in climatological records, for more than 50 years now. The mechanism that drives it is apparently quite simply but, perhaps because my knowledge of the basics of atmospheric circulation is not great, I am struggling to get my head around it all and I don't feel confident that I could explain it well enough. This is a link to an introduction of the basic mechanism with a few diagrams that is, perhaps, one of the easiest to understand explanations I have managed to find online - Introduction to the Quasi-Biennial Oscillation. This other website is also worth a look at, if you are interested in QBO, as it breaks most of it down into bullet points and picks out only the main points - The Quasi-Biennial zonal wind Oscillation (QBO). In short,
Zonal mean wind as a function of time and latitude at 10mb
QBO:
- oscillation in mean zonal winds of the Equatorial stratosphere between easterlies and westerlies
- period of 28 months
- westerly shear zone propogates downwards more regularly and rapidly that easterly ones
-phase of the QBO affects the location of the extratropical surf zone by moving the zero wind line
- tropical mixing extent is dependent on the QBO phase
strong mixing extends to low latitudes of QBO pahse in stratosphere
Brewer-Dobson Circulation:
- large-scale middle atmospheric circulation
- responsible for long-term persistent transport of air and chemical nutrients from the troposphere to the stratosphere
- driven by Rossby wave breaking in the tropical stratosphere
Tropical Pipe:
- Tropical Pipe model of stratopsheric transport
- Tropical region bounded by subtropical edges of the wintertime surf zone which is isolated from the vigorous mixing of the extratropic surf zones
- edges of the Tropical Pipe barriers are moving


The seminar discussed the "influence of the stratospheric potential vorticity distribution in lateral mixing and transport into and out of the tropical pipe, th elow latitude ascending branch of the Brewer-Dobson circulation" and then presented the clear pattern that apparently exists between the above and the phase of QBO. I think the idea was that the phase of QBO dictates the amount of mixing that occurs as the phase of the QBO affects PV (potential vorticity) structure in the stratosphere. So, during the westerly phase, a strong PV is expected at the Equator which would isolate the Southerm Hemisphere from mixing and allow for greater 'in' mixing. During the easterly phase, stronger PV gradients at the subtropics limits Northern Hemisphere mixing and so particles remain in the tropics, where little mixing into the tropics occurs. I not quite sure if this is making any sense at all as I think the more I write about it the more confused I get about it all - therefore it is probably best that I just leave it at that! Sorry, I realise that my write-ups about the seminars have been really bad but honestly, they have all very quickly gone way past my level of understanding so, writing about the basics that they have been based on is about as much as I am currently able to manage.


Anyway, it was another great day and I hope Millie enjoyed it too!

Wednesday, 3 August 2011

Met Office Work Experience - Day 1 (for Monday)

I am an extremely lucky student as for a few days this week I will be at the Met Office in Exeter with the 'Oceans, Cryosphere and Dangerous Climate Change Gourp'; and today (Monday) was my first day! And, because this is such a privilege, I thought I would share with you some of the things I get up to and learn! You will have to bear with me on this thoughh as I can't even pretend to say that I understood everything that I heard about today - the vast majority of it went over my head - and I think my brain is still trying to take it all in!

One of the first things I did today was to sit in on a meeting of the Ocean Biochemistry Working Group whom, like the names suggests, do lots of research into the oceans - whether that be linked to ecocsystems or carbon dioxide uptake or DMS and lots more! Particular focus is placed on the factors affecing carbon dioxide uptake of the oceans and various negative feedback loops that they believe exist involing phytoplankton and temperature control (an idea I will come back to at a later date). This session was really interesting and gave me a really good insight into the work that some of the researchers at the Met Office do. Much of this research is based on calculating the amount of chlorophyll in the oceans and this can be linked to phytoplankton and plankton blooms. Due to its influence on global climate change, the study of such things is crucial in understanding likely future changes in climate. Phytoplankton take in carbon dioxide and is one of the ways in which the oceans take in carbon dioxide as it allows the carbon to sink deep into the oceans where it can be stored. This is an example of a biological carbon dioxide uptake process used by the oceans but there are also physical processes that are responsible for the ocean's uptake of carbon dioxide too. Carbon dioxide dissovles more easily in cold water that in warm water and it also dissolves more easily in sea water compared to pure water because sea water naturally contains carbonate ions (I will spare you from as much of the chemistry as possible at this stage!). The reaction of the carbon dioxide with carbonate produces hydrogen carbonate and because of this reaction, only 0.5% of the inorganic carbon in seawater occurs as carbon dioxide gas. Since levels of carbon dioxide are so low in seawater, more carbon dioxide can enter the oceans from the atmosphere. Something that I never knew before today was that carbon dioxide can be stored in 3 different 'forms' in the oceans and the oceans ability to do this enables it to store more carbon dioxide. Anyway, if the water stays at the surface and warms up as it moves around the globe, the carbon dioxide will relatively quickly escape back to the atmosphere but (this is where I can make a link to my EPQ!) if the water sinks to the deep ocean, the carbon can be stored for more than 1000 years before the general ocean circulation (via the upwelling of the THC after it has completed its circulation of the globe) returns it to the surface. This is one of the reasons that the current circulation pattern is so important as regions in which the sinking of deep water occurs are also, therefore, major physical carbon dioxide removal areas - especially the North Atlantic.

After a tour of the building (which is massive and very modern!) I attended a seminar on "The sensitivity of the energy and water cycles to different forcing agents" by Nathalie Schaller from the Institute for Atmospheric and Climate Science, ETH Zurich, Switzerland. I will try and talk about some of the background of this seminar as the majority of it discussed various models - something that went way over my head! It is now commonly accepted that, as a result of anthropogenic influences, primarily greenhouse gas emissions, that the hyrdological cycle, on a whole, will be intensified which, in turn, will have major impacts on human soieties and ecosystems. Therefore it is vital that more reliable statements about future changes to precipitation patterns can be found and this is where various global climate models come in. The variabilty produced by various models leads to some uncertainities which are then only amplified by the added complications of forcing agents such as solar forcing and carbon dioxide. So, basically, this seminar consisted of the results of running various simulations with different forcing factors, at varying levels and over varying temporal and spatial scales, to see what the likely impacts are. I think that one of the main messages was that the relationship between the energy and hydrological cycles with the forcing factors, especially CO2, was not linear and so say increasing the forcing agent by x2 wouldnt just lead to twice the impact on the hyrdological cycle and in many cases it is more. Despite the content being far to advanced for me to even start to really get an substantial understanding of it, it was really interesting to see some of the worrk happening in various research departments around the world and, if I manage to do a bit of reading over the next few days, I may write a post on the alterations that the discussed factors could make to the movement pattern of the ITCZ and the global impacts of this as this was something briefly touched upon.

Then, to finish off a great day, I had a discussion with a researcher about ocean circulation. Lots was covered, which I won't go into too much now but I am hoping to be allowed to include some of it in my EPQ. Something I think I will briefly discuss is the idea of vorticity as it is important in explaining the differing characteristics of eastern and western boundary currents and the formations of gyres - I might elaborate on it at a later date (perhaps including some maths!). Energy and mass are not the only properties that must be conserved as momentum also has to be - both in terms of linear momentum (associated with motion in straight lines) and angular momentum ( associated with rotatory motion). Vorticity essentailly means the 'tendency to rotate' and it is referred to as 'tendency' rather than simply 'rotatory motion' as water can be aquiring both positive and negative vorticity at the same time. Therefore, instead of saying the conservation of angular momentum or tendency to rotate, it is referred to as the conservation of vorticity. Ocean water have rotating movements on all scales - from large basin wide subtropical and subpolar gyres to tiny eddies. For water to have vorticity, therefore the tendency to rotate, it doesn't have to been enclosed in a closed system as, as long as there is a current shear (a change in velocity at right angles to the direction of flow), rotatory motion will be possible. Mainly due to the fact that it apparently makes the maths easier, a tendency to rotate anti-clockiwise is referred to as positive and a tendency to rotate clockwise is referred to as negative. I mention a before about that fact that water could aquire both positive and negative vorticity and the first time I heard this I was a little confused but an example I was given helped me to understand it a little better. So, water could be aquiring positive vorticity as a result of current shear provoked by friction with an adjacent water body or coastal feature (say a spit), whilst also aquiring negative vorticity from a wind blowing clockwise. Therefore the actually motion will depend on the relative sizes of the two tendencies and so, in theory, no rotational motion could be the result as the tendencies could be equal. This rotatory motion is caused by wind stress and so is said to be relative vorticity but, as with anything linked to ocean cicrulation, the rotation of the Earth complicates things and so the vorticity possessed by a parcel of fluid on the rotating Earth actually has planetary vorticity - this is where the Coriolis force links in. When I have talked about Coriolis force before, I have explained it in terms of the poleward decrease in the eastward velocity of the surface of the Earth. However, although this is okay for the basics, there is something missing........... In addition to this linear eastward velocity, the surface of the earth also has an angular velocity which means that, in the Northern Hemisphere, it turns anticlockwise about a local vertical axis (southern hemipshere is opposite). This angular velocity os latitude dependent and so there would be a relative motion between the moving parcel regardless of the direction it was initially travelling in; with this relative motion increasing with increasing latitude (this applies to both winds and currents). This is where a lot of maths comes in but I will try and skip over most of it as I am struggling to get my head around all of it! Linear eastward velocity decreases with latitude whereas the angular velocity about a local vertical axis increases latitude. The bigger the angle between the Earth's axis of rotation and the local vertical axis, the smaller the angular velocity of the surface of the Earth about this local vertical axis and so, at the Equator, where a vertical axis is perpendicular to the axis of rotation, the angular velocity is zero. So, I guess what I am trying to say is that any parcel of fluid on the Earth shares the components of the Earth's angular rotation, appropriate to that latitude. I hope you kind of followed that - if you did it would be really good to know as then maybe I can include it in my EPQ! It is quite a tricky area and I am still trying to fully understand it and I haven't even got into much of the maths yet! I will come back to this idea soon though as when you combine it with a summary of Stommel's (he is this guy who has done loads of thereotical stuff on the basics of ocean circulation) calculations, it helps to explain the characteristics of different boundary currents - which is both relevant to my EPQ and I find it quite interesting!

Sorry for not going into much detail about these things but I still need to do a bit more further reading and perhaps some images to aid my explanation and my brain is rather tired and I need a good nights sleep! Honestly, I don't think I slept at all last night as I was like a little kid on Christmas Eve - but to be honest who can blame me as, being an aspiring Geographer, I really couldn't of asked for much more as a kind of early Christmas present really! Anyway, I will come back to these various topics at some poitn soon and write something that is more beneficial for you all to read...................

I have another extremely interesting day to look forward to tomorrow with another meeting, seminar and some more discussion groups and so, if I manage to contain my excitement, my blog post will hopefully make more sense and be a bit more logical!

Sorry that this is a bit late in arriving, I couldn't seem to get the post to publish over the last few days so its kind of all out of time but better late than never I suppose!