Showing posts with label AS Geography. Show all posts

Sunday, 29 April 2012

Geography related Books and Films

Teachers may disagree with this but I dont necessarily think that staring at a textbook all night every night is the only way to revise. Of course there is no substitute for hard work but sometimes (especially for development) I think that watching a relevant film can be quite good. Now for those of you who have kept up with your three hours extra reading each week since Septembet (haha!) then you may have watched/readed a few of these but seeing as a few have asked me for suggestions, I thought I would just qucikly write it all up on here! Follow the links for more detailed reviews, explanation of relevance to modules and trailers....
Development and Globalisation:
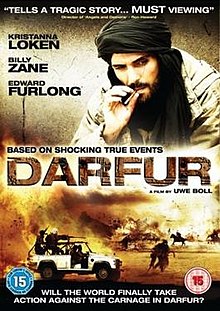
Darfur - a group of international journalists travel to a village in Darfur in search of evidence to persuade the UN that genocide has occured but are forced to live after the Janjaweed turn up and threaten to kill them. I am sure you are all aware of the Darfur Crisis and it is a case study you caould name-drop into an answer, also could be useful AS population module but be warned it is very graphic and definetly not one for the faint-hearted!

Invictus - after 27 years imprisionment, Mandela becomes South Africa's first elected president and this film follows his bid to unite the country via the rugby world cup, seeing unification as a prerequisite to development.

Goodbye Bafana - follows the unlikely friendship that forms between Mandela and his prision officer and illustrates some of the social and political impacts of colonialism in South Africa and how they continued to hinder development.

Blood Diamond - amid the explosive civil war overtaking 1999 Sierra Leone; it explores many issues including those surrounding the diamond trade, supply of arms to rebels and child soldiers. This includes links to globalisation, colonialism, the 'paradox of plenty' and simply how civil unrest prevents development.

Painted Veil -  set in China, in the 1920's, and explores the impact of a cholera outbreak on a village, including references as to how religious beliefs make containing cholera even more challenging and the impacts of an earthquake. Focuses quite a bit on the importance of a water supply to development - the link to the module is slightly more tenuous than with some of the other films and books but it is still worth a watch!
Cry Freedom - in South Africa and tells the true story of Biko and his friendship with a white liberal newspaper editor. Good film to watch for development as explores impact of apartheid on development and the importance of political stability for development to occur.

Gandhi -  a biopic about the life of Gandhi with particular reference to his prominent role in India's struggle for freedom from colonial rule.

Slumdog Millionaire - provides an insight into the life of children living in the Indian slums the problems associated here. Also illustrates how they are trying to improve education to enable development.

Erin Brockovich - a good film that presents the negative impacts of the natural gas industry and the extent to which large companies are prepared to go to, to cover this up. Not only would this be good for the AS Energy module but also globalisation with reference to the negative impact of TNCs.

The Constant Gardener - a rather sad story about how a drug company exploit the Kenyan population to allow them to test a new drug, despite the fact they know it has harmful side effects. Also explores the idea of corrupt governments and issues faced in LDCs.
The Cove - this film is very thought provoking and presented the issues surrounding the dolphin trade - before watching this I didn't know a lot about the issue, especially the scale of it in Japan, and it left me feeling very shocked that something like this still exists today in such a developed country. Issues of groupings, tied aid and trade are briefly explored also.

Blood River by Tim Butcher - tells the story of Tim Butchers quest to retrace the journey taken by H.M Stanley in the 1870s. from this you get an insight into the history of the Congo and the factors have effected its development - great book for the development and globalisation module as it provides an insight into the impact colonialism has had on Africa. Chasing the Devil: On Foot Through The Killing Fields of Africa is another Tim Butcher book, although this time based in Sierra Leona, that covers many issues intrinsic to low levels of development in Africa and the problems associated with this.

The Boy Who Harnessed The Power Of The Wind by William Kamkwamba and Bryan Mealer - tells the extraordinary true story of a Malawian teenager who overcame many obstacles to provide electricity and clean water for his village by capturing the energy in both the wind and the sun. Good for AS Energy as well as A2 development and illustrates the importance of energy supplies and appropraite technology to development. It also touches on the issues of living in areas of climatic extremes, the role of education and how corrupt governments influence aid distribution.
PeopleQuake: Mass migration, ageing nations and the coming population crash by Fred Pearce - a book about the population bomb and how demographics is driving politics. Explore how we got to this point and where we are currently heading and how it can be solved. Therefore it is a great book for AS Population (covers practically the entire module with some useful case studies and statistics!) and for A2 development and Globalisation. Human geographers will not doubt love this book but any geographer out there, like myself, who get carried away with the science and forget to mention people, this book is worth a read!
Globalization and Its Discontents by Joseph Stiglitz - as chief economist at the World Bank that author has a unique insider's view into the management of globalisation. In this book he speaks out against the IMF and WTO and the role of the West in driving global politics. This makes it a very good book for globalisation!

Plate Tectonics and Associated Hazards:
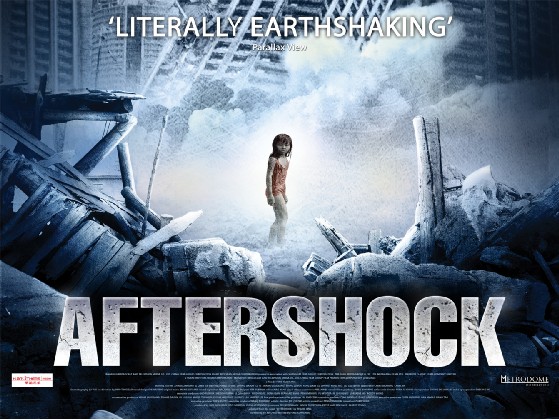
Aftershock - based around the Tangshan 1976 earthquake, which killed 242,000 people and coincided with huge political changes in China. This film cover issues including aid, politics and follows China as it changes over the time period covered. However, it is centred on one question; which 7 year twin will the mother chose to save? Bewarned it is a very said film, Millie was not overexaggerating when she said it was!

Dantes Peak - we watched this one in class, the worksheet we used in lessons is on Millie's blog so this could be a useful thing to watch and complete again as part of your revision. Covers preparation, evacuation and monitoring techniques as well as a few inaccuracies that you should be able to point out!
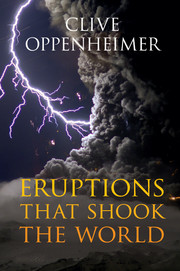
Eruptions That Shook The World by Clive Oppenheimer - I havent quite finished this book yet but I thought I should mention it as I am finding it quite useful for finding the odd statistic or two! Bascially this book covers everything we need to know about volcanoes and a bit more! Geologists, this is probably a really good book for you to read, but for Geographers it does link all the volcano stuff back to its impacts on people.

Weather, Climate and Associated Hazards:

The Day After Tomorrow - the Larsen B ice shelf collapses, the thermohaline circulation shutdowns, provoking glacial inception in the northern hemisphere, with other appending impacts - a good film to watch and then point out the geographical/scientific mistakes to test how much you have understood about the influence of ocean circulation on global climate and how a freshwater input could affect it!
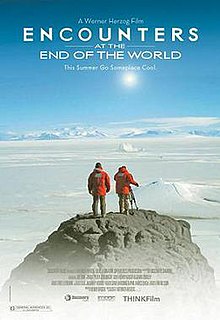
Encounters at the End of the World - a great documentary with some simply stunning footage and interesting interviews that collectively provide an insight into life in Antarctica and the important research that is taking place
The Age of Stupid - great film to watch for the energy module as it talks about climate change, energy consumption and production via some interesting case studies so also good for the A2 climate module
Gaia by James Lovelock - presents the Gaia hypothesis which is the idea that the Earth functions as a living organism and so self-regulates to adapt to changing conditions. This book puts forward some very interesting ideas, linked very closely to climate change both naturally and anthropogenically forced, making for an interesting read!

 The Revenge of Gaia by James Lovelock - applies the Gaia hypothesis to global climate change - again an intriguing read which presents some interesting ideas and solutions to problems we are likely to face with population expansion and coming global climate change
An Inconvenient Truth by Al Gore - I am guessing most will have heard of this one! It presents the issue of climate change and discusses how it has been caused and the impacts it is likely to have - well worth a read but if you prefer there is also a film version.

Our Choice by Al Gore - this book follows on from An Inconvenient Truth by offering the solutions Al Gore thinks are required to solve the issue of global climate change
Here on Earth by Tim Flannery - This is essentially a "revolutionary dual biography of the planet and our species." It covers the history of the earth from its earliest origins to the world we currently live in. it offers answers to a long list of questions - How did life first emerge? What forces have shaped it? Why did humans come to dominate? And when didiwe start to have an impact? How has this changed use as a species? It is probably wise to have a bit of knowledge of the Gaia hypothesis before reading this as it does mention this a bit. It is a very interesting book and one that leaves you questioning why on earth we did some of the things we have and continue to do - essentially a great book for all Earth Scientists!
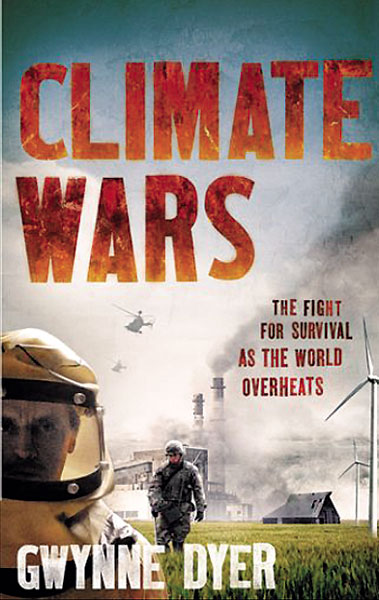
Climate Wars: The Fight For Survival As The World Overheats by Gwynne Dyer - "An increase of 2C in average lobal temperature - which is almost inevitable - will hear global politics to boiling point." Bringing together extensive interviews and latest research this book revela the realities of a planet facing scarce food, water and land. Can out technology save us, or is it too late? It is written in an interesting way as takes the science, makes it understandable before focusing on what excatly this means for society now and in the future. Any geographers out there, like myself, who get too carried away with the science of climate change, without consideration of what that means for people, this book is definently worth a read!!!
Storms of My Grandchildren: The truth about the coming climate change and our last chance to save humanity by James Hansen - covers global climate change, with both causes and consequences and the more contemporary role of politics, especially in the USA, in climate research - an interesting read but in places the level of science goes beyond the A-level syllabus.

Well, there are plenty more but this is probably enough to keep you busy for a while! There are also all the relevant documentaries, parts of which we have watched in lessons, like How Earth Made Us, for example, and I think quite a few of them are in the LRC. Unfortunately not many Geography related things are that happy so perhaps don't watch/read them all at the same time! I am still on the hunt for a 'happy' geography film or book! If you have any suggestions for others, or any comments on the above, let me know!


Thursday, 5 April 2012

Blogging Updates!!!

Hello everyone! I have had countless requests about writing blogs in my other subjects and I also need to find a new method for revising in some of my other subjects, therefore, I have decided to start writing them in my other subjects....

What I learnt in History this week.....

What I learnt in Biology this week.....

What I learnt in Chemistry this week.....

Now, these blogs will not be as detailed, or as frequently updated as my Geography blog as trying to run one is time consuming enough - let alone four! It may take me a while to get the going as well as I am not 100% sure how well they will work in my other subjects! Also they will be used as revision blogs, where I will post mainly revision notes, not any interesting research I do beyond the syallbus or necessarily a lesson by lesson post on what I learn. At present, they are not going to be supported by teacher blogs either but, for those of you interested, they may still be of some use.
Essentially though I am hoping they can be used in the same way as this one, and hopefully be as beneficially to fellow students, so as usual, if you want me to write about anything just let me know!

Also, I quick word about my Geography blog...... I am going to try and reduce the scientific content and keep it to a level required to pass the exam. This means that until the summer exams are over, no more of my own research will appear and I will be talking a lot more about humans. This is going to be hard work for me (so bare with me - I am not quite sure how well this one will go!) but I have been given a few polite reminders now that Geography is all about the interactions between people and the environment and so whilst I may find the physical side far more interesting, unless I can relate it back to how it impacts on peoples lives, then I will not pass the summer exam -  and I think it is about time I start listening to my teachers! So sorry to those of you who enjoy reading about the random stuff I write about but for the next 3 months it will have to disappear (don't worry though I have the entire summer holidays to research all the interesting stuff that the exam board are not nice enough to let us learn about - in their defence I suppose it would be bad if we enjoyed A-levels too much!!!). Most people are probably revising already so let me know what you feel would benefit you the most if I wrote about it. Case studies will definetly be appearing before many of you ask!!! I am currently trying to think of some different, more interesting ways, to revise Geography before I write a post on revision like last year - there are some good books and films out there which would be worth reading/watching; reviews are on the way!

After half term, Millie is starting up weekly online workshops on all the different topics, but in the meantime, after popular request, I am going to and use the method to run online discussions on different topics - especially the human geography topics - as discussion is a great and more interactive way to learn and, as we get frequently reminded, for the exam we need to be able to formulate our own opinions (something that takes me a while!). Join in as and when you can, hopefully they will remain educational throughout! The first one starts tonight at 19:30!

Just incase you are interested, I am retaking Unit 4B (topic doesn't look that bad - anything climate related will grab my attention!!!) so information on that, although less researched based stuff, will appear as and when and if these live discussions work out well, I may try and organise a 4B one over the next few weeks.....
I hope the revision is going well - I think the hardest bit is getting started!

Wednesday, 11 January 2012

Spearman's Rank

SPEARMAN'S RANK:- A test for the relationship between two variables
---> Not only does this test highlight a relationship but it also indicates the strength and statistical significance of the relationship, if any
---> You should always get a value between 1 and -1, if not then you have gone wrong somewhere! The closer to 1 the stronger the positive relationship, the closer to -1 the stronger the negative relationship.
---> Remember you have to compare you result to the critical values (I believe we get given these in the exam when appropriate) to see whether or not the relationship is statistically significant enough to accept and use to formulate conclusions regarding variables investigated.
Worked Example using Column C and Column F in AIB
The first thing you need to do is to set a positive and null hypothesis; the easiest way to do this is to say, 'There will be a relationship between x and y' and 'There will not be a relationship between x and y'. Although it seems a bit strange that you have to set a null hypothesis, it is actually more statistically reliable to disprove a null hypothesis than to prove the alternative hypothesis.
Positive Hypothesis: There will be a relationship between number of owner occupied dwellings as a % of total dwellings and of number of people in higher managerial and professional occupations as a % of total economically active.
Null Hypothesis: There will not be a relationship between number of owner occupied dwellings as a % of total dwellings and of number of people in higher managerial and professional occupations as a % of total economically active.
Again, the easiest way to do this calculation is within a table. What you need to do is to rank each variable independently, giving 1 to the highest and so on. When you have two values that are the same you add together the places they would rank, then divide it by how many would rank there (e.g if three values would rank 13, you add together 13, 14 and 15 and find the middle value which is 14 and asign each one 14), then skip the same number of ranks to ensure that the lowest ranking number is given the same number as n (number of values) - sorry this is really hard to explain in words but hopefully will become a bit clearer in a minute!
 Hopefully, the ranking part is quite logical. Within the first variable, when there was two 73, for example, that would both rank 14, you need to add 14 and 15 together, then divide by 2.
14 + 15 = 29
29/2 = 14.5 so, rank both 14.5 then skip rank 15 and move onto 16 for the next ranking number
After you have independently ranked both data sets, you need to work out the difference between the
ranks.....
Basically all you do, using first one as an example: 2 - 3 = -1
Then you need to square the difference, hence why it does not matter if the difference is negative.....
After squaring the difference, you need to add up all the values in that column, to give you the sigma d squared bit from the orginal equation...
S = 423
Now you have all the values you need so can just plug the numbers into the equation
Rs = 1 – (6 x Σd2)/n3 – n
Rs = 1 – (6 x 423)/183 – 18
Rs = 1 – 2538/5814
Rs = 1 – 0.436532507
Rs = 0.56
That is the calculation, itself, completed but now you have to see whether or not you can accept the relationship shown using critical values.
When n = 18
Critical Values:
95% = 0.4014
99% = 0.5501
---> Data reliability is related to the size of the sample. The more data you collect, the more reliable your result.
I think normally you are given these in the exam, but I suppose if the examiner was not feeling that nice, they could ask you to work out the 'Degree of Freedom', then use a graph to work out the values yourself!
Degree of Freedom = n - 2
So, in this example 18 - 2 = 16, so you draw a line up from 16 on the x-axis
---> After doing this, I can say that I can accept the positive hypothesis as it has a 99% significance, meaning that there is a relationship between the two variables. Looking at the Spearman's Rank value, I can then say that there is a relatively strong positive correlation within the data, so as the number of people in higher managerial and professional jobs increases so does home ownership in Poole. Without even knowing the first thing about Poole, this kind of makes sense, in a general context, but it is important to remember that just because the two variables correlate, it does not really prove anything - only further research can actually prove that one thing affects the other.
So, that is the last of the stats test that AS students need to know for their skills exam - I hope these posts have been helpful to you as well, there is one on fieldwork sampling on its way which might also be useful, and I hope the revision for your first A-level Geography exam is going well - unfortunately, for us A2 students, the stats test don't stop there; Mann Whitney U and Chi Squared are on there way!

Standard Deviation

STANDARD DEVIATION :- describes the average amount by which the values in a data set vary from the mean for that set.
---> It indicates the amount of clustering around the mean; showing how much the values are clustered allows the analysis of data to be taken much further than simply measuring central tendency.
In a normal tendency:-
- 68% of the values lie within +/- 1 Standard Deviation (SD) of the mean
- 95% of the values lie within +/- 2 SD of the mean
- 99% of the values lie within +/- 3 SD of the mean
---> A low SD indicates a more clustered distribution. A higher SD indicates a more spread-out/dispersed distribution.

Worked Example using Column B in AIB (Population density- persons per hectare)


4.42, 18.52, 16.73, 22.02, 38.44, 24.39, 36.64, 37.99, 23.04, 53.24, 33.66, 37.07, 34.97, 20.61, 27.76, 25.61, 26.04, 14.87
n=18
First thing to do is work out the mean, in the same way mentioned above: 495.9/18 = 27.55
                                                                                                                      
Then, you need to subtract the mean, individually, from each of the values in the data set and then square the result. This can take a while but I find it easiest and quickest to do it in a little table....
x
4.42
18.52
16.73
22.02
38.44
24.29
36.64
37.99
23.04
(x-x-)2
535.00
81.54
117.07
30.57
118.59
10.63
82.63
109.00
20.34

x
53.24
33.66
37.07
34.97
20.61
27.76.
25.61
26.04
14.87
(x-x-)2
659.98
37.33
90.63
55.06
48.16
0.004
3.76
2.28
160.78

Next, you need to add up all the values on the bottom row of the table - the (x- xbar) squared results - and this gives you sigma (S)
S = 2163.4


Then divide this value by (n-1), remembering than n = number of samples/values
2163.4/18-1 = 127.26
Then square root the result to give you your SD value,
Square root of 127.26 = 11.28
---> This result indicates that 68% of the population densities for the different regions of Poole lie within +/- 11.28 of the mean (27.55), illustrating large disparity across Poole in terms of population density.
---> Ideally when doing Standard Deviation you should complete one for two sets of data and compare the results (like you do for the Rivers fieldwork where you complete standard deviation for sediment size in pool's and riffles then compare the results, before using knowledge of Hjulstrom and velocity changes you recorded to explain why results deviate accordingly). So, as an example for Poole, if you calculate the standard deviation for 'owner occupied dwelling as % of total dwellings' (Column C) and 'rented from council or Housing Association as % of total dwellings' (Column D) you would see that Column C displays greater deviation than Column D, suggesting that across Poole, houses rented from the council are move evenly distributed than those privately owned and occupied, then using the background knowledge of Poole you have, you could try to explain why this trend occurs. 

Tuesday, 10 January 2012

Mean, Mode, Median and Interquartile Range

I realise that stats test are not everyone ones favourite thing to do and that most people find them very confusing, with even the thought of a table of numbers quite scary......however, with practice they are not too bad and you could never be expected to do a entire stats test in an exam due to time constraints; so as long as you are prepared for them, they can be quite easy marks to get (hopefully!).

I am going to start with the basics and cover the measures of central tendency as well as Interquartile range which, as a measure of dispersion, would perhaps be better placed with Standard Deviation. Any AS students reading this, apologises for the frequent references to Poole but I hope it still helps! The other 4 stats tests are quite lengthy so I will do a separate post for each one - they will hopefully appear very soon!

MEAN:- Add the numbers up and divide by the numbe of numbers
---> Often favoured over mode and median as takes into account extreme values, which the others disregard.
e.g 2,4,6,8,10,12,14
Mean = 56
              7
          = 8
MODE:- Most common number - if no number is more common then there is 'no mode'
e.g 2,4,6,8,10,12,14
Mode= no mode
e.g 2,2,4,6,6,6,8,10,10,12,14
Mode = 6
---> In Poole fieldwork it could be used to calculate which is the most common bird found in Holes Bay, for example
MEDIAN:- the (n+1) = value
                             2
e.g 2,4,6,8,10,12,14
Median = 4th value = 8
---> Could be used after traffic counts to estimate daily/weekly traffic flows across a particular area

---> If a set of values has a symmetrical distribution (normal distribution), the mean, mode and median will be at the same place. However, if the distribution is skewed, the mode will still be at the point of highest frequency but the median and mean will each lie elsewhere.

INTERQUARTILE RANGE (IQR) :- Distance between the 75th percentile (UQ) and the 25th percentile (LQ)
---> IQR is a measure of dispersion, with the bigger the IQR, the wider the distribution in the data.
---> Often used to draw 'box and whisker plots'/dispersion diagrams as they illustrate spread of a number of values around the mean value, enabling a comparison of spread and/or bunching of data.
---> IQR and Standard Deviation both measure dispersion (spread), but IQR is more resistant to outliers whilst Standard Deviation is sensitive to outliers and extreme observations.
Lower Quartile (LQ) = (n+1) = value
                                          4
Upper Quartile (UQ) = 3(n+1) = value
                                           4
IQR = UQ - LQ
e.g 2,4,6,8,10,12,14
LQ = (7+1) = 2nd value = 4
              4
UQ = 3(7+1) = 6th value = 12
               4
IQR = 12 - 4 = 8

Hopefully most people are okay with this, just ask though if you would like a worked example from the AIB.....
     
Standard Deviation and Spearman's Rank are on the way (I will probably do Chi Squared and Mann Whitney U at some point later this week - AS students, you are lucky enough not to have to know these two yet!).

As always, let me know if I have made any mistakes or if there is anything else you would like me to cover!!!

Wednesday, 4 January 2012

Graphical Methods of Presenting Data

This is perhaps more relevant to AS students with their up and coming skills exam but knowing about all the lovely graphs we are expected to understand and use is no bad thing!

Line Graphs and Bar Graphs
There are several different types of line graphs that can be used in geographical enquiries:
- Simple Line Graphs = drawn to show a single series of data e.g precipitation
- Comparative Line Graphs = show two or more data sets on the same graph. Often, lines are drawn using the same scales on the x-axis and the y-axis e.g flood-storm hydrograph
- Compound Line Graphs = drawn with several different components (AS students, bewarned you will see a lot of these in the Energy module!). Important to remember to use axis to measure the 'bands/layers' separately.
- Divergent Line Graphs = used when one set of data is proided for part of the period under consideration and then this data set is split into separate components for another part of the period.

A similar variety of bar graphs exists.....
- Simple Bar Graphs = shows a single set of data
- Comparative Bar Graphs = shows two or more sets of data. The columns for each division along the x-axis are drawn side by side
- Compound Bar Graphs = show how the total in any one bar is divided up between a number of subtotals
- Divergent Bar Graphs = start as simple bar garphs but then become compound bar graphs when subtotals become avaliable

Advantages of using Bar Graphs
  • show each data category in a frequency distribution
  • display relative numbers/proportions of multiple categories
  • summarize a large amount of data in a visual, easily intepretable form
  • make trends easier to highlight than tables do
  • estimates can be made quickly and accurately
  • permit visual guidance on accuracy and reasonableness of calculations
  • accessible to a wide audience
Disadvantages of using Bar Graphs
  • often require additional explanation
  • fail to expose key assumptions, causes, impacts and patterns
  • can be easily manipulated to give false impressions
Scatter Graphs
= show nature of the relationship, if any exist, between two sets of variables
- Positive Relationship = both variables increase
- Negative Relationship = one variable increases and the other decreases
- No Relationship = no pattern, ith points distributed at random
- Strength of the relationship presented is also indicated, once a line of best fit is drawn (although, it is not always suitable to draw one). The greater the number of points within a closer proximity to the best fit line the stronger the relationship; allowing analysis to be made upon which conclusions can be drawn. Such analysis is subjective though and so often carrying out a Spearman's Rank is a better option, if you want the most accurate and precise expression of strength and reliability of the relationshiop between variables.

Pie Charts
= used to show the proportion of the total represented by each category; with each sector representing a component and the size of the sector illustrating what proportion that component contributes to the whole
angle = number in the category   x 360
                     total number

Advantages of using Pie Charts
  • display relative proportions of multiple classes of data
  • size of the circle can be made proportional to the total quantity it represents
  • summarize a large data set in visual form
  • be visually simpler than other types of graphs
  • permit a visual check of the reasonableness or accuracy of calculations
  • require minimal additional explanation
  • be easily understood due to widespread use in business and the media
Disadvantages of using Pie Charts
  • do not easily reveal exact values
  • Many pie charts may be needed to show changes over time
  • fail to reveal key assumptions, causes, effects, or patterns
  • be easily manipulated to yield false impressions
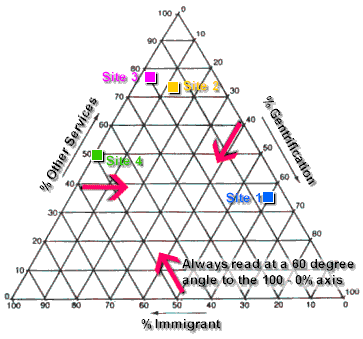
Triangular Graphs= really just a scatter graph that shows three sets of variables
- usually used when plotting employment structures (primary, secodnary and tertiary sectors) or soil structure
Kite Diagrams= plotted to describe distribution of different species along a transect line; so used to compare changes in different variables
- most commonly used for dune transects

Radial Diagrams
Used to show:-
           - ORIENTATIONS as given by points on a compass; often used to indicate oreintations of particles in glacial deposits so direction of ice flow can be determined
           - CONTINUOUS CYCLE, such as daily or annual progressions

Dispersion Diagrams
- Sometimes called 'Box and Whisker plots'
- Used to show spread of a number of values, displaying range, median, interquartile range, lower quartile range and upper quartile range

I realise that this isn't the most exciting stuff to read but I couldn't think of a more interesting way to write this all up - however, fellow A2 students there is hopefully some Poole-related intertactive timelines and maps on the way! But first, I need to cover statistical tests, especially considering how much my class seemed to 'love' doing them last week.....


Monday, 31 October 2011

Global population = 7 Billion

UN predictions suggest that today the world's population reaches a staggering 7 billion and I have to admit that it is pretty cool, although slightly scary, to think that I share my birthday with the 7 billionth inhabitant of Earth -  quite fitting considering it is Halloween!

The graph above illustrates where I fit into the picture - 5,582,734,706th person when I was born, making me the 80,819,731,395th person ever alive on Planet Earth - follow the link to find out which 1 of 7 billion you are....

I realise you are not going to be short of things to read on this topic over the coming weeks so I am not going to delve to much into the details of this pretty historic moment but first up for a few statistics that I am sure we could all slip into a Geography essay (or two!) over the common year...

Globally, every hour there are:
- 15,347 births
- 6, 418 deaths
= Average yearly increase of +1.162%
Fast-growing country is Qatar at +514 people per day
Fast-shrinking country is Moldova at -106 people per day

Highest life expectancy is in Japan at 82.7 years
Lowest life expectancy is in the Central African Republic at 45.9 years

97/100 new people on the planet are currently being born in developing countries

In the UK, the population is around 62156764 and every hour there are:
- 85 births
- 66 deaths
- +23 immigrants
= Average yearly growth of 0.6%
Average life expectancy is 79.6 years (81.7 for females and 77.4 for males)

It is quite hard to visualise all these statistics regarding population expansion but this interactive graphic produced by the Guardian, based on the UN projections, is quite good, especially when aiming to make comparisons between countries. Whilst talking about the Guardian and the resources they offer, they are very good at reporting on development and environmental issues and so checking up on that ever so often would be a good way to keep up with your independent reading, or if you are likely to forget to check you can like the facebook pages for both. However, if the thought of reading lots doesn't really excite you much then they also produce podcasts which are not too long and quite interesting to listen to - I find some of them quite good for helping me form opinions on this human geography stuff - here is the link to a recent podcast on population growth.

Whats next? Will people numbers stop rising?
The global population is expected to continue to increase during the course of this century, reaching 10 billion by 2083 - follow the link above to see a clip that illustrates this quite well. However, the rate of this growth is expected to slow in comparison to the rapid rate of exapnsion witness over the last 100 years. Little of this growth is happening in countries such as the UK, who are expected over coming years to see a drastic reduction in growth with many possibly experiencing negative growth. Instead, the growth is occuring in the developing world - with Asia presently experiencing most growth although this is soon likely to switch to Africa. We have recently placed quite a bit of focus on to the issues of ageing populations and so it is easy to forget that the world's population is actually quite young, with 43% under 25 (this constitutes 60% of the population across developing countries).

I have been struggling to know what excatly to write but the idea of writing a letter to the 7 billionth person caught my eye so I thought I would give it a try.......

Dear 7 billionth person,

First up, welcome to the world! We havent really been looking after Earth that well and unless we start to change our attitude then the future does not really look that bright......

I am trying really hard not to start on a negative but I have to admit its not easy. 7 billion people on the planet - I doubt if you said that 50 years ago anyone would have believed you, especially in the given timescale. 1 billion people added to the planet in 12 years is crazy and worryingly, for a while atleast, the rate of population expansion could continue to accelerate before it begins to slow down - I would love to know what Thomas Malthus would think about this all if he was still alive today. Anyway, whilst its easy to focus on all the doom and gloom that the future may hold, I think that this historic moment in time warrants us all to sit back and reflect, reflect on the progress made my mankind over the past few centuries. As a race we have come so far and the fact that I can stand here today and say that the global population has reached 7 billion is real testament to the great thinkers of  past generations who have solved so many of the problems society has face. Yes, we have made some huge mistakes in the past, and prevail to do so, but enough of us have learnt from this to allow for progress to be made. If you are born into a developed country (although this is unlikely considering 97/100 babies are born in developing countries) you will have access to all the simply remarkable scientific discoveries and technological advancements that have been made and therefore we be able to experience the best that we have so far achieved. If you are fortunate enough to be granted this luxury, please don't be ignorant to the fact, like so many, that the world is full of inequality, poverty is rife and suffering is an unnerving norm for so many. Suffering extends to the environment we inhabit and there is no hiding the fact our current status has been built on unsustainable foundations whilst we continually threaten our world in an unacceptable and, possibly, unforgivable way.....

Perhaps, its good that the UN have decided not to name the 7 billionth inhabitant of Earth as I feel a lot of responsiblilty would have been placed on you. Instead I think the number and the idea itself that there are 7 billion people on planet Earth should be enough (hopefully!) to shock people into changing - if we don't change (and soon!) then the thousands of children born each day are only going to inherit problems, problems generated by our ignorance and arrogance. Unification is what is required as we all need to act together if our efforts are to have the desired effect. Of course, politcans and public figures leading the way will help but we need to want to change for ourselves and the good of mankind. Hopefully the symbolic nature of your existance should catalyses the reaction needed to bring about required change but we are, as a global community, quite unpredictable and do some strange things, our persistant abuse of the Earth's finite resources even though we are fully aware of the consequences just one example.

You symoblise perfectly the issue of over-population, an issue that needs to be addressed, especially as we seem intent on continuing the unsustainable lifestyles a significant amount of us lead. This problem is slightly trickier to solve than environmental issues, to some extent, as why should we have the right to dictate how many children a couple can have. Its one that, until recently, has not been publicised enough across the world and is an issue that will only get worse before it gets better. Whilst I understand the theory behind possible solutions to this issue I am not confident enough to offer a solution, as to most of the problems this world faces, but I live in hope that one day someone will and we will all listen. When that day will be, who knows, but if current trends continue it is likely to be the time at which it is almost too late. Sounds a little skeptical I know but that seems to be the way the world works these days..... we fail to change until our bank accounts feel the impacts!

Advice I can give you...... well I cannot really offer you much in the way of life advice apart from enjoy it, make the most of any access you can get to education (it really is the key to the future), be yourself, help others to the best of your ability and strive to make a difference. Don't live in the past but don't ignore it, learn from the mistakes some have made. Adaptablity is going to be the key in the future, we have messed with systems we are yet to fully understand and thus the consequences are unknown, so we have to be prepared to adapt to the coming changes and make comprimises with the environment we live in. Whatever you do, just don't lose hope with the human race, unpredictability can work both ways and hope is all that some have. It is easy to look at the future and give up but we have always found ways in the past, and hope in the future is the only way forward. If you want to really do something with your life when you are older, and be able to offer solutions to the problems our and future generations face, then become a scientist/politican. This world needs another great thinker, someone who is willing to take the risk of looking far outside the box and take a chance on their gut feelings. Whilst we currently have many great scientists who are making advancements towards understanding the impacts of anthropogenic forcing, we are in desperate need of someone who can understand this knowledge, convey it to the wider audience in a way that will grap their attention and demand their support. We need someone that can unite the world, which I realise sounds strange considering we all pretty much  share the same common goal and are more connected to each other than even before. I fear that, if we are not carefull, the resource war, which could be immentent, will be catastrophic and leave the world in an even worse state than before. This resource war, at present, may remain a theory held by many but I believe we will all learn to fear the idea, especially when the unnerving probability of it occuring not too far in the future becomes public knowledge - a war that could easily violently erupt within our lifetimes.

The symbol you form could start to unite the world and make us reflect, with the words 7 billion, I am sure, spoken far more than 7 billion times tomorrow. Its key we allow this milestone passing to have some form of resonance so in  years time we can identify this date as a key turning point in the history of mankind.....

......the day humanity decided to stop, think, reflect and ultimately change

Well I live in hope! Good luck in the future, I wish you all the best in life and what you decide to make of it.

Vicki


Writing that I harder than I thought it would be and I have perhaps been slightly skeptical (poor kid!). What would you say to the 7 billionth inhabitant on Earth, any advice or warnings you would give them?

Saturday, 3 September 2011

Darfur - A student's film review

My Geography film of the week this week was Darfur - a film that was suggested we watched for the Development and Globalisation module. Before I write any more I have to emphasise that Millie's warning about this film is one to strongly consider before watching it as it is very graphic (really not one for the faint hearted) and is a film that I would suggest you watch with a cushion nearby to hide behind - trust me, it is more graphic and horrifically shocking than 'Shooting Dogs', that film Millie made us watch at Christmas!

This film tells the story of the journey taken by a group of international journalists in the Darfur region as they search for evidence that suggests genocide has/is happening. Unaware of what they might find, this group of international journalists visit a small village in Darfur under the protection of the African Union (AU). They manage to persuade their guide to take them to a village in Janjaweed territory and when they arrive, the journalists see how the Sudanese live daily in fear of rape, torture and murder by the government and rebel militia. Whilst interviewing the Sudanese men and women for accounts to take back home to convince the UN that genocide has occured, the Janjaweed militia turn up and threaten to kill the journalists if they do not live immediately.......


I am not quite sure how much you will know about what has happened in Sudan, before it split this year, and the events that this film is losely based on, so I will attempt to summarise some of the key points.  Civil conflict has occured on and off in Sudan for decades but in 2003, the Sudan Liberation Army (SLA) and Justice and Equality Movement (Jem) began attacking governments targets after accusing Khartoum of oppressing black Africans in favour of Arabs. Most of the tension built up in the Darfur region which had already experienced decades of violence and tension over land and grazing rights between the mostly nomadic Arabs and farmers from Massaleet and Zaghawa communities. Government response to this rebellion wasn't approved by the international community as they admitted to mobilising what they classed as ' self-defence militia'. However the President denied all accusations that they had links to the Arab Janjaweed militia who were accused of trying to drive out black Africans from large expanses of Sudan. Refugees from this conflict say that this is wrong as air raids by government aircraft were followed by Janjaweed attacks, who would ride into villages on horses and camels, slaughtering men, raping women, taking children and stealing whatever they could find.
There has been a lot of controversy over whether or not it should be classed as a genocide as firstly they are unsure excatly how many were killed and many of those that died, died due to starvation or disease. Many human rights groups and the US have said that genocide has infact taken place but, after an investigation in 2005, the UN concluded that war crimes had been committed but there had been no intent to commit genocide. The UN has estimated that since 2003 over 300,000 people have died (mainly believe that the actually figure is much higher) whilst 2.7 million have been displaced - mainly to refugee camps near the main towns or to neighbouring Chad where, as it has a similar ethnic make-up to Darfur, the violence has spilt over. The situation in Sudan has been incredibly unstable and unsecure for years and so many aid agencies have been unable to reach those that most need the help with some even being banned from northern Sudan following the arrest warrant for the President in 2009 for alleged war crimes.
I am guessing that most of you will know enough about what has happened most recently in Sudan, with reference to its split, but if you don't there is plently to read about it on the internet!

Is this a good geography film? Well, before I watched it my brother asked my what it was all about so I told him a bit about the background to the film and his first remark was to question what excatly genocide and the recent events in Darfur have got to do with Geography. Whats the answer.......well genocide effects both people and the environment and geography is all about people and the environment and how the interact. Going down the more human geography route first, genocide has impacts that can fill all the parts of S.P.E.E.D. Often the conflict can stem from social unrest, which can be generated via political unrest, and results in huge long-lasting societal and political changes. Geopolitics can become involved due to the view taken and role played by the international community. This can, in turn, lead to trade embargoes and cause fluctutations in the global market and thus effect the economies in countries across the world aswell as the country in which the conflict occurs.  Demographically, bites would become visible in population pyramids of that country whilst bulges in others due to forced migration. The mass migration away from the affected regions provokes the development of refugee camps which further increase issues with food and water availability, sanitation, spread of disease and all the other problems that are generated by the shear volume of people in such a small area being dependent on already previously limited resources. Migration to other countries only allows the violence and detrimental impacts of the conflict to spill over into neighbouring countries - an action in some cases that only sustains the violence. You can then link it to issues with aid getting to the people who need it and what types of aid are best in these situations etc. Honestly, this list could go on and on and I am sure you could think of a dozen more links to human geography straight away without too much thought; so what about physical geography? This is slightly harder but not impossible, especially if you look into what provoked the conflict. In a previous post I have already touched on the link between climatic changes and conflict and, with particular reference to the Darfur crisis, there is debate over the role played by regional climate changes in the initiation of the conflict with many arguing that drought and desertification played an influential role in stimulating civil unrest. You then have all the impacts that the conflict has on the environment so for example, if you can remember back to when we did that assignment for the energy module which included questions on the use of appropriate technology in Rwanda to help the coffee farmers as the conflict has destroyed much of the plantations and left the land unusable which then obvisouly have knock impacts on society. So, hopefully this proves the link between genocide and geography (I did manage to persuade my brother they were linked, although not to watch the film) so now I need to answer whether or not this is a good geography film.......

This film seems to have the sole purpose of shocking the watcher and it very successfully does this by presenting some truly horrific scenes. In terms of educational content, it definetly replicates what life in Darfur in the height of the conflict would have been like for people but it leaves a lot of questions unanswered - something which, to a certain extent, can be good as it should inspire you to go away and do your own research/reading into the topic. I think in relation to our geography course it is a film to watch and then link it to what you know about development, factors that affect it and the current situation in that part of the world etc. The current situation in Africa definetly sprung to mind: why didn't NATO and other international organisations get involved straight away to provide protection for the people when they rather rapidly got involved in Libya this year? For me, as a geography film from an educational perspective, I think it focuses too much on shocking the audience than necessarily educating them, although it does pick on a few key points like issues with aid agencies and the role of the international community, and I think most people will end up spending rather a lot of the time not actually watching the film but looking away (I certainly did!).  I have to admit though that although I recognise that in some cases people need to be shocked into realising/accepting/understanding/taking action etc., I am not a big fan of it and I personally feel that this film went a little bit to far down that route. Despite this, there are many things that you can learn from the film and it is, without a doubt, very thought provoking! If you have a strong stomach then watch it and read up on the details about the Darfur Crisis afterwards, the knowledge you will gain from doing so will really help with geography in general as it can be linked to some many different topics - I think you could possibly even link it right back to colonialsim in relation to how colonial powers literally chopped up Africa, with no consideration of how they were dividing cultural and ethnic groups and, certainly in Sudan, the north saw far greater development than the south. After watching this film you will certainly be able to understand why both North Sudan and South Sudan are at their currently levels of development.

So, if you think you can cope with the simply horrific and disturbingly graphic scenes which run throughout this film then watch it, as I have said you will learn things from it, but I just hope you heed mine and Millie's warnings beforehand - it really isn't one to watch if you haven't got a strong stomach, it is probably a good idea to watch it with some who has so they can tell you to look away at certain points and it will leave you feeling rather depressed, shocked and horrified afterwards that these sorts of things have actually occured - feelings only intensified by the realisation that similar events have occured on the same, and large scales, in other countries around the world.