Showing posts with label Development Indicators. Show all posts

Tuesday, 3 April 2012

Development revision - the basics

Hello everyone - this is the first, of many to come, revision posts over the next few weeks, so enjoy!
Development Mindmap
Development Continuum
The development continuum is the contemporary way of viewing development; percieving it as a contiual process and recognising that it can occur in a number of different ways, not necessarily in the way the UK did, as outlined by the Rostow Model of Development. Ranking countries using HDI, a composite indicator, essentially the development continuum is a sliding scale from most to least developed with lots of intermediates such as RICs and NICs; meaning it illustrates the complexities that the Brandt Line fails to display. Therefore it also indicates the importance of the changing roles of countries such as the Asian Tigers, orginally LDCs who attracted TNCs and consequential cumulative causation accelerated development. Now they are mature NICs and their role in the global economy has changed and will change again as they continue to develop and the global shift moves. This idea has replaced older classification (like first, second, third world and MEDC/LEDC) as the use of LEDC and MEDC as discrete groups implied that all countries within that group are of the same development level, which is not the case, and subsequently the development continuum is more reflective of reality.

Gross National Product (GNP) = total value of goods and services for a country's companies at home and abroad
Gross National Income (GNI) = GDP plus or minus the interest and repayments on debt
Purchasing Power Parity (PPP) = measure of the value of the local currency
Gross Domestic Product (GDP) = total value of goods and services within a country (including foreign companies)
Issues with using GDP as a measure of development:
- Inequalities = in many LDCs wealth remains with a few and does not filter down through population
- Informal employment = in LDCs many work in informal employment, such as street vending, so money is exchaged without record
- Subsistence lifestyles = many farmers lead a subsistence lifestyle, so it is impossible to accurately measure income and population

Composite indicators vs Single Indicators
Development is the process of social and economic advancements that leads to improvements in peoples quality of life and general wellbeing, as such when trying to measure it, it is important to not only consider the economic indicators. This realisation, was one of the main driving forces behind moving away from first, second, third world classification and the Brandt Line, to the development continuum. HDI, for example, takes into account GDP using PPP, life expectancy at birth and educational attainment, thus considers several aspects of development. Therefore just because a country is rich, i.e Qatar which has a really high GDP, does not mean it scores highly on HDI, and vice versa as seen with Kerala which has a low GDP but would rank high on HDI. However, there is clearly often a positive correlation between GDP and HDI as countries with a high HDI can distribute funds to health care and education, subsequently raising life expectancy and educational attainment. Despite this, composite indicators make global comparisions a lot easier but some composites, like HPI, are subjective, meaning that it is a less accurate measure of development than solely using GDP. There are some advantages of using single indicators as they do not shroud individual measures and so, with regards to pinpointing what social and economic improvements are required for a country to develop, should also be taken into consideration when determining level of development.

Rostow Model of Development

Produced in 1960, this model can be used as a rough guide to development and, in conjunction with the Demographic Transition Model can be used to formulate population policies. Transitions between both models are very similar, illustrating the intrinsic link between population and development. Rostow suggeseted that all countries could break the viscious cycle of poverty and develop between this 5 stages. However, it is very eurocentric and underestimates the role of colonialism in early development of the 15 countries it is based on.


Wednesday, 9 November 2011

All those 'lovely' development acronyms............

Okay, so I realise that my blogging record since we started back in September has been appalling but I am going to try and sort that out so that I start writing regular and (hopefully!) useful blog posts again. My plan for the next few weeks is to write all the book reviews of the books I have been reading over the last half term, write a couple posts on current issues/discursive topics relevant to the Development and Globalisation module we have just finished, write a summary sort of revision post on everything we have covered so far (with special emphasise on the areas that people have asked me to write posts on) and then make a start on our exciting new module - Plate Tectonics and Associated Hazards! So where to start? Well, after my classes appalling performance in the quiz on Monday, I thought a post on all the development acronyms was desperately required. There are quite a few to remember so let me know if I miss any off this list!

Classification of Countries
LDC = Less Developed Country
e.g Sierra Leone, Haiti, Myanmar
- 33 out of the 50 LDC's are sub-Saharan
- highest HDI ranking of LDC is Gabon at 119th and then South Africa at 121st (out of 197)
What makes an LDC?
1. Income below $750 per capita per year
2. Weak human resources
     - Health
     - Education
     - Nutrition and calorie uptake
3. Economic vulnerability
     - Instability of exports
     - Instability of agricultural production

MDC = More Developed Country
e.g USA, UK, Norway

NIC = Newly Industralised Country (more than last 40 years)
e.g South Korea, Hong Kong

RIC = Recently Industralised Country (last 40 years)
e.g Brazil, Russia

ORC = Oil-Rich Countries
e.g Qatar, Saudi Arabia

LLDC = Land-Locked Less Developed Country
e.g Central African Republic, Bhutan, Moldova, Bolivia
SIDS = Small Island Developing States
e.g Vanuata, Dominican Republic, Seychelles
HIPC = Heavily Indebted Poor Countries
e.g Rwanda, Ghana, Afghanistan
- 29 out of the 40 HIPC's in the world are sub-Saharan

Development Indicators
HDI = Human Development Index
= Compoisite indicator first used by the UN in 1990 to replace the sole use of GDP
Takes into account:-
   - GNI PPP per capita
   - Years of schooling
   - Life expectancy at birth
End figure is between 0 and 1, with proximity to 1 indicating development of a country
e.g 1st = Norway 0.943, 28th = UK 0.863, 84th = Brazil 0.718, 101st = China 0.687, 134th = India 0.547, 187th = DR Congo 0.286 - it is worth checking out an updated list as this years results were released by the UN last week

HPI = Happy Planet Index
- Introduced by the New Economics Foundation (NEF) in 2006
- Doesn't indicate which is the happiest country in the world but the relative ecological efficiency with which human well-being is delivered around the world
- First index to combine environmental efficiency with human well-being
- However it is based mainly on opinions not facts and so is subjective
e.g 1st = Costa Rica, 2nd = Dominican Republic, 3rd = Jamaica, 20th = China, 74th = UK

PQLI = Physical Quality of Life Index
- Developed in the 1970s due to dissatisifaction with the use of GDP
Takes into account:-
   - Literacy Rates
   - Infant Mortality
   - Life expectancy at age 1
- Criticised as there is considerable overlap between IMR and LE

GDP = Gross Domestic Product
= the total calue of goods and services within a country (including foreign companies)
What are the issues with using GDp per capita as a measure of development?
1. Inequalities: - In many LDCs the wealth remains with a few people with control over the government and industry so does not filter down through the population
2. Informal Employment : - In LDCs many people work in the informal business sector, such as street vending, and so money is exchanged without record and, therefore, does not appear during GDP calculations
3. Subsistence Lifestyles: - Many farmers lead a subsistence lifestyle and so it is impossible to accurately measure income and population

GNP = Gross National Product
= the total value of goods and services for a country's companies at home and abroad

GNI = Gross National Income
= GDP plus or minus the interest and repayments on debt

PPP = Purchasing Power Parity
= essentially a measure of the value of the local currency (basically how much can be brought in a country with a set amount of money)

International Groupings
EU = European Union
- 1957 Treaty of Rome created the European Economic Community (EEC) which had 6 members (France, Italy, West Germany, Belgium, Netherlands and Luxemburg). Slowly more and more countries have joined and there are now 27

AU = African Union
- Founded in 2002 to succeed the Organisation of African Unity (OAU)
- Includes all African nations apart from Morocco who left the OAU in 1984 and Madagascar who were suspended in 2009
Aims to: -
   - Accelerate political and socio-economic integration of the continet
   - Promote democracy and human rights
   - Achieve continental peace
   - Promote and defend Africa's voice in world affairs

NAFTA = North American Free Trade Agreement
- Founded in 1994 to create a free trade zone, encourage investment in each other and promote competition
- Grouping consists of USA, Canada and Mexico

NATO = North Atlantic Treaty Organisation
- Founded in 1949, with 28 members, and is classed as an intergovernmental military alliance
- Accounts for 70% of the world's defence spending

OPEC = Organisation of Petroleum Exporting Countries
- Founded in 1961 and consists of 12 countries all of which are net exporters of oil. They are responsible for setting the global oil prices

OECD = Organisation of Economic Cooperation and Development
- Founded in 1961 to replace the Organisation of European Economic Cooperation (OEEC) which was founded in 1948
- Includes 34 countries and aims to stimulate economic progress and world trade

AOSIS = Alliance of Small Islands States
- Established in 1990 with 42 countries to consolidate the voices of SIDS to address global climate change

UN = United Nations
- Founded in 1945 and has 193 members
- Aims to promote and provide international law and security, economic development, social progression, human rights and world peace

APEC = Asia-Pacific Economic Cooperation
- 21 members bordering the Pacific Ocean all pledging free trade

G-8 = Group of 8
- Group of the worlds major economies. Founded in 1975 with France, Canada, Germany, Italy, Japan, UK and USA. Russia was then added to make it the G-8 in 1997.

G-20 = Group of 20
- The G20 was established in 1999, in the wake of the 1997 Asian Financial Crisis, to bring together major advanced and emerging economies to stabilize the global financial market.


G-77 = Group of 77
- Currently 130 members who are all LDCs, constituting the largest intergovernmental organisation of developing states in the UN, providing LDCs with a greater voice. China has always been an very close ally of this group but is not an offical member.

BRIC = Brazil, Russia, India, China / BRICM = BRIC + Mexico
- The world's emerging markets
- Why do the BRIC's matter?

All the others which I can't think of a catergory for

MDG = Millenium Development Goal
- Eight development goals that 23 internation organisations and all 193 UN members agreed to aim to achieve by 2015

TNC = Transnational Coporations  MNC = Multinational Coporations
- Corporation that has production establishments or delivers services in at least two countries. Some TNCs have grown so large that they have budgets that exceed those of many countries in which they operate

FDI = Foreign Direct Investment

CPC = Communist Party of China

SEZ = Special Economic Zone
e.g Many set up in China, for example, like Bejing to act as growth poles and all development to spread

SAR = Special Adminstrive Regions
e.g Hong Kong

GATT = General Agreement on Tariffs and Trade
- Formed in 1947 during the UN Conference on Trade and Employment but only lasted until 1994 when it was replaced by WTO

WTO = World Trade Organisation
- Replaced GATT and aims to gradually lower barriers to international trade. Liberalising organisation created by capitalist economies

IMF = International Monetary Fund
- Founded in 1945 with 29 members but has since grown to 187
- Promotes international economic cooperation

DfID = Department for International Development
- UK government department that seperated from the Foreign and Commonwealth Office in 1997
- Aims to promote sustainable development and eridicate world poverty

NEF = New Economics Foundation

UNESCO = United Nations Education, Scientific and Cultural Organisation

ERDF = European Regional Development Fund
- Aims to strengthen economic and social cohesion in the EU by correcting imbalances between its regions

ISO = International Organisation for Standardization
- Ensures the standardization of containerization across the globe

NGO = Non-Governmental Organisation

I don't think I really appreciated just how many there were until I started writing them down! Hope this helps - let me know if I missed any of the list....


Wednesday, 15 June 2011

The start of A2 Geography!

I am guessing that most of you will have had, at least, your first A2 Geography lesson and so I thought I would just do a quick round up of what I have learnt so far in the new module - Development and Globalisation!

What excatly is development?
Development is the process of social and economic advancement which leads to an improvement in people's quality of life and general wellbeing.

Different people percieve development in different ways and so they will, accordingly, determine development using different indicators. However, there are some common indicators which we associate with developed countries. These can be classified using SPEED - something I think we might be using a lot in this year!
Social
  • access to sanitation
  • low ratio between doctors:patients and teachers:students
  • emancipation of women
  • equality in terms of education and career oppurtunities
  • multiculturalism (often allowed to occur due to open door policy on migration)
  • no discrimination against gender, sexuality or race etc
  • human rights upheld
Politcal
Economic
  • high GDP per capita
  • imports and exports
  • good level of employment - especially in the higher sectors
Employment Sectors:-
- Primary = farming or mining
- Secondary = any manufacturing or refinement
- Tertiary = shops or any similar services
- Quaternary = education
- Quinary = high level finance and research and development

Enviromental
  • energy supply and comsumption
  • environmental targets such as the Kyoto Agreement
  • organic farming and similar examples of stewardship
  • protection and conservation
Demographic
  • low CBR and CDR and high LE
  • high stage of the Demographic Transition Model
  • steady/decline in population growth
Although we often use these indicators to determine development, it cannot be accurately assessed using just one indicator. Instead composite indicators are used........

Physical Quality of LIfe Index (PQLI)
---> Literacy rates
---> Infant mortality
---> Life expectancy at the age of one
  • It was developed in the 1970's due to peoples dissastisfaction with the use of GDP
  • It is criticised as there is considerable overlap between infant mortality and life expectancy
What are the problems with using GDP as a measure of development?
Inequalities :- In many LDC's the wealth remains with a few people, often those with control over government and industry, and does not filter down through the rest of the population.
Informal Employment :- In LDC's many often work in the informal employment sector, such as street vending, and so the money exchanged is not recorded and so it does not influence the GDP.
Subsistence Lifestyle :- The subsistence lifestyles means it is impossible to accurately measure income and often population size.

Whilst on the topic of GDP, I think I might go through a few definitions......
Gross Domestic Product (GDP) = the total value of goods and services within a country (including foreign companies)
Gross National Product (GNP) = the total value of goods and services for a country's companies both home and abroad
Gross National Income (GNI) = GDP plus or minus the interest and repayments on debt

Human Development Index (HDI)
---> Life expectancy at birth
Gives an indication of the quality and avaliabilty of healthcare, quality of diet and quality of life
---> Educational Attainment
This measure combines adult literacy rates with the number of people enrolled in primary and secondary education (basically the average years of schooling) and so indicates equality (in terms of gender) and the quality and accessibility of education
---> Adjusted income per capita
Real GDP per capita based on PPP - purchasing power parity - this is essentially a measure of the value of the local currency (how much can be brought with a set amount of money)
  • The HDI is the average score of the three variablse and is expressed as a value between 1 (highest) and 0 (lowest)
  • It was designed in the 1990's, by the United Nations, to shift the focus onto human development by incorporating more social and economic data
  • Some think it is a measure of how 'Scandinavian' a country is
  • It does not include any ecological measures and cannot provide a global perspective
  • Not all countries, as some are unable or unwilling, are ranked 


      0.900 and over
       0.850–0.899
       0.800–0.849
       0.750–0.799
       0.700–0.749
       0.650–0.699
       0.600–0.649
       0.550–0.599
       0.500–0.549
       0.450–0.499
       0.400–0.449
       0.350–0.399
       0.300–0.349
       under 0.300
       Data unavailable


    And the actually figures for the last HDI 

    1.  Norway 0.938 (steady)
    2.  Australia 0.937 (steady)
    3.  New Zealand 0.907 (increase 17)
    4.  United States 0.902 (increase 9)
    5.  Ireland 0.895 (steady)
    6.  Liechtenstein 0.891 (increase 13)
    7.  Netherlands 0.890 (decrease 1)
    8.  Canada 0.888 (decrease 4)
    9.  Sweden 0.885 (decrease 2)
    10.  Germany 0.885 (increase 12)
    11.  Japan 0.884 (decrease 1)
    12.  South Korea 0.877 (increase 14)
    13.  Switzerland 0.874 (decrease 4)
    14.  France 0.872 (decrease 6)
    1.  Israel 0.872 (increase 12)
    2.  Finland 0.871 (decrease 4)
    3.  Iceland 0.869 (decrease 14)
    4.  Belgium 0.867 (decrease 1)
    5.  Denmark 0.866 (decrease 3)
    6.  Spain 0.863 (decrease 5)
    7.  Hong Kong 0.862 (increase 3)
    8.  Greece 0.855 (increase 3)
    9.  Italy 0.854 (decrease 5)
    10.  Luxembourg 0.852 (decrease 13)
    11.  Austria 0.851 (decrease 11)
    12.  United Kingdom 0.849 (decrease 5)
    13.  Singapore 0.846 (decrease 5)
    14.  Czech Republic 0.841 (increase 8)


    1.  Slovenia 0.828 (steady)
    2.  Andorra 0.824 (decrease 2)
    3.  Slovakia 0.818 (increase 11)
    4.  United Arab Emirates 0.815 (increase 3)
    5.  Malta 0.815 (increase 5)
    6.  Estonia 0.812 (increase 6)
    7.  Cyprus 0.810 (decrease 3)
    8.  Hungary 0.805 (increase 7)
    9.  Brunei 0.805 (decrease 7)
    10.  Qatar 0.803 (decrease 5)
    11.  Bahrain 0.801 (steady)
    12.  Portugal 0.795 (decrease 6)
    13.  Poland 0.795 (steady)
    14.  Barbados 0.788 (decrease 5)

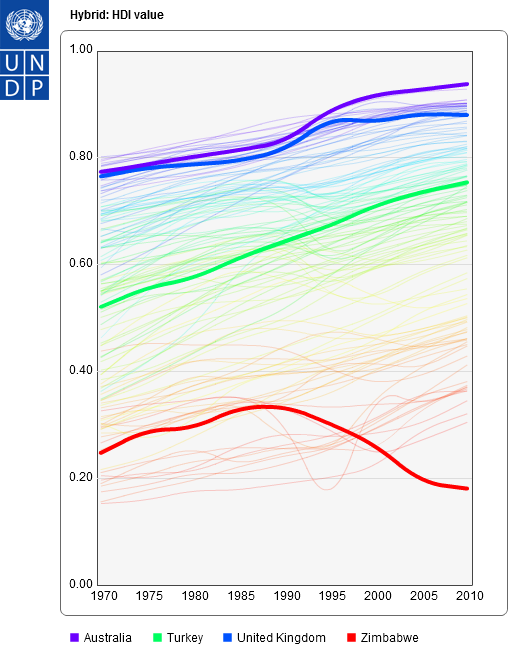
I realise that some people don't really like just looking at lists of numbers and so if you are more of a visual learner this interactive graph is quite good - just follow the link -  http://hdr.undp.org/en/data/trends/ 

Happy Planet Index (HPI)
---> Ecological Footprint
---> Life expectancy
---> Life satisfaction
  • Doesn't show how 'happy' a nation is. Instead it shows the relative efficiency with which nations convert the planet's natural resources into long and happy lives for their citizens.
  • It is the first composite indicator to combine enviromental indicators
  • It is criticised for the confusion provoked by its name and the fact that it is very difficult to measure life satisfaction. It is also criticised as it does not include any political measures including political freedom and human rights.
Here is the link (http://www.happyplanetindex.org/explore/global/index.html) to the map on the HPI website. By looking at this map, it is clear to see that many countries are ranked lower due to a poor ecological footprint and this is why many of the countries who feature so highly on the HDI feature much lower on this ranking.

So, which composite index is best? Thats for you to decide and there is probably no right or wrong answer on this, so let my know what you think and why.....

The above is a quick run through of the main development indicators we use but how excatly, in the past, have we catorgorised countries?

One of the earliest classifications of development was to divide the worlds countries into three broad groups:

FIRST WORLD - this was the 'developed' world which included western Europe, North America and the other countries considered to be developed. Most of these countrie were either democratic or capitalist
SECOND WORLD - these were all the state controlled communist countries like the former USSR and China
THIRD WORLD - the 'developing' world which included basically every country that didn't fit into either of the above two groups (countries in Africa, Asia and Latin America)

After the fall of the Soviet Union, in 1991, the term Second World couldn't really be used anymore and so the definitions of the First and Third World changed ever so slightly. This change was also accompanied by the realisation that this classification system was too simplistic to offer and real idea of the level of development present in a country.

Next came the idea of spliting countries into either MEDC, LEDC or NIC but again, after a while, it was realised that it was wrong to focus purely on the economy of the country as, like clearly shown in the definition of development, the economy is not the only indicator of development.

In 1980 the Brandt line (also known as the North South Divide or 80/20 line) was developed to offer and alternative way of looking at the spatial differences in development around the globe.

The Brandt Line provides a visual of the ways in which the developed countries of the world are distributed and so demonstrates the general trend that the North as around 80% of the GDP but only 20% of the population. Again, this is slightly to simplistic to use and the emergence of more and more RIC's and NIC's means that the distribution of development is not as simple as it used to be. This is then further complicated by the fact that development is not a static thing, instead it is a continual process.

The idea of development being a continual process, or sliding scale, is known as the development continuum and it originates from the realisation that there is no template for development or a right or wrong way to approach it and therefore all countries develop in different ways and at different speeds.  I am not quite sure how well this graph actually links in with the idea of the development continuum but its quite a nice one to look at to see the differing speeds of development and shows how, in terms of development, Asia is starting to catch up with countries like the UK and Japan (http://www.bbc.co.uk/news/world-asia-pacific-13746908)

And, finally, the last topic we discussed was the development gap. The development gap is simply the difference between the most and least developed countries in the world and, again, it is a topic that you need to form your own opinion on. So, is the development gap getting wider or smaller? How can the gap be reduced? Do we, as a developed country, really want it to disappear all together?